
The Macro Pressure Point: 10-Year Yields Bite
Before zooming into Bitcoin’s chart, the macro picture deserves a hard look. The U.S. 10-year Treasury yield climbed 0.66% on the day to 4.57% — a move that historically acts as a gravitational pull against risk assets. Higher yields lift the opportunity cost of holding non-yielding assets, and in prior cycles this kind of yield spike has triggered broad crypto selloffs. The S&P 500 and Nasdaq held their composure, closing up 0.42% and 0.29% respectively, which tells us equity markets are not yet in panic mode. Gold slipped 0.41% to $4,113, consistent with a mild risk-recalibration rather than a full flight-to-safety rotation. The Dollar Index barely moved, adding just 0.03% to 100.97.
So why is Bitcoin trading at $63,971 with only a -0.37% 24-hour loss while altcoins are bleeding? XRP is down -0.95% on the day and -3.02% on the week. Solana has shed -1.16% in 24 hours and -4.09% over seven days. BNB is flat. The divergence is the story.
BTC Dominance at 56.22%: The Structural Signal
BTC dominance holding firm at 56.22% is the most important number in today’s market, and it does not get enough attention in mainstream coverage. When a macro headwind like a yield spike arrives, a genuine risk-off move drags Bitcoin down alongside everything else — capital exits crypto entirely. What we are seeing instead is rotation within the asset class. Institutional and sophisticated retail money is not leaving crypto; it is consolidating into Bitcoin specifically. This pattern mirrors the behavior observed in late 2023 ahead of the ETF approval cycle, when BTC dominance climbed steadily while alts drifted.
Spot Bitcoin ETF flows have been a quiet but consistent bid. Even on days when sentiment turns cautious — the Fear & Greed Index is currently reading 26 (Fear) — the ETF structure provides a baseline of institutional demand that did not exist in prior cycles. That structural bid is likely one reason Bitcoin is holding technical support that, in a different market environment, would have cracked already.
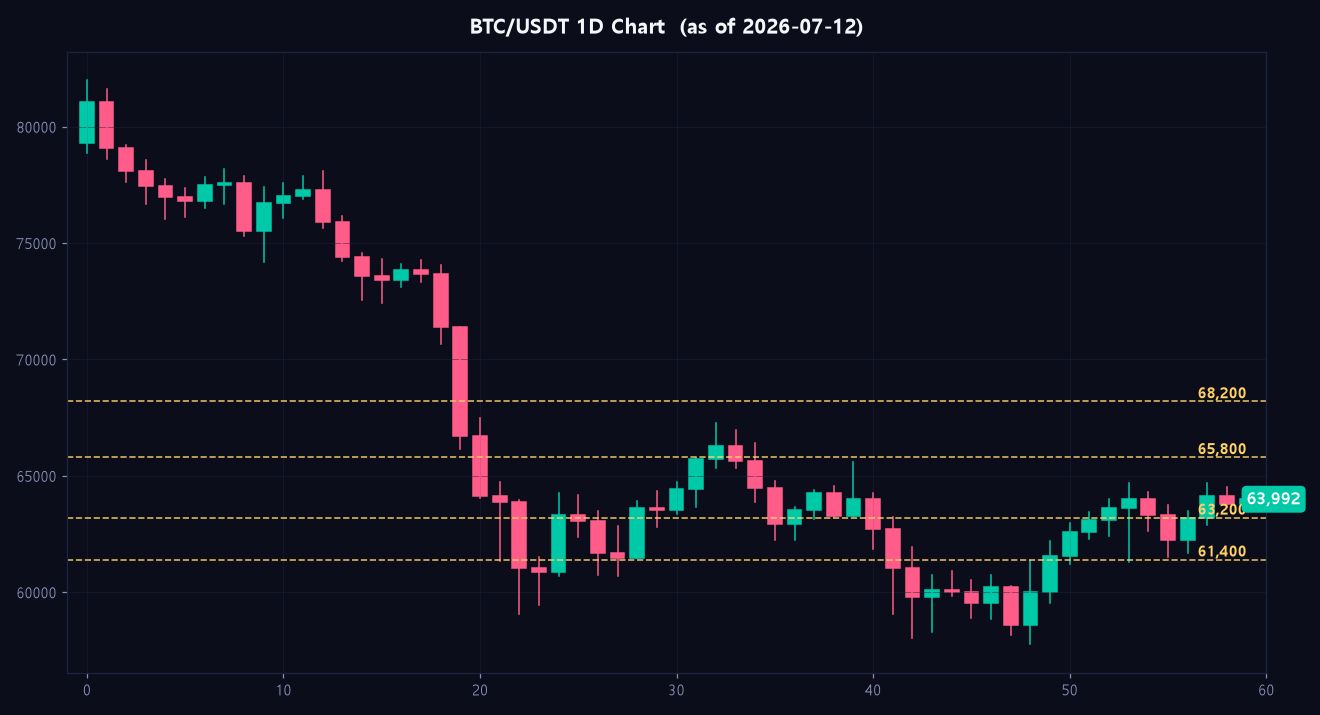
The Technical Confluence Map: Why $63,500–$64,200 Matters
As the chart shows, Bitcoin is sitting at an extraordinary technical crossroads. Three independent frameworks are pointing at the same narrow price band, which is the definition of a high-conviction zone.
- 200-day Simple Moving Average: Sitting near $63,200, this is the battleground line between a structurally bullish and structurally bearish market. Weekly closes above it carry enormous weight for trend-following funds and systematic strategies.
- Weekly 0.618 Fibonacci Retracement: Measured from the March 2025 all-time high down to the subsequent pullback low, the 0.618 level lands precisely in the $63,200–$63,500 range — reinforcing the SMA support and creating a zone of layered demand.
- Lower Boundary of Rising Wedge: Price has been contained within a rising wedge pattern for six weeks. The lower trendline of that wedge has now converged with the SMA and Fibonacci level. A weekly close below this cluster would be a technically significant breakdown signal.
These three factors compressing into a single zone make $63,200 the line in the sand for weekly close purposes. Above it, the structure is intact. Below it, the conversation changes quickly.
Fibonacci Extension Targets and Invalidation
If Bitcoin defends this confluence and resumes its advance, the Fibonacci extension framework drawn from the March ATH drawdown offers two concrete upside targets. The 0.5 retracement-based first extension lands at $68,200 — a level that also aligns with a prior consolidation ceiling and would represent a meaningful reclaim of recent highs. The 1.618 extension, which historically marks the conclusion of impulsive legs in trending Bitcoin markets, projects to $72,800. That second target would effectively mark a new post-ATH exploration phase.
The invalidation level is equally precise: a weekly close below $61,400 would negate the bullish count entirely. This is not a daily wick stop — intraday excursions below $63,200 can be tolerated. But if Bitcoin settles a weekly candle under $61,400, the rising wedge has broken, the SMA has been decisively lost, and the probability of a retest of $57,000–$58,000 structural support rises sharply.
Futures Sentiment: Heating Up But Not Overcooked
The derivatives market is offering a nuanced read. The funding rate sits at +0.0079% — positive, meaning longs are paying shorts, but nowhere near the overheated readings above +0.02% that have historically preceded sharp liquidation cascades. The long/short ratio of 1.31 shows a lean toward longs without extreme crowding. Long accounts represent 56.6% of the market. Open interest has declined -2.47% in 24 hours, suggesting some deleveraging has already occurred — which is actually healthy in the context of a support test. There is short-squeeze potential here if bulls defend the zone and force leveraged shorts to cover. If you are actively trading this range, fee rebate signup links are listed at the bottom of this post.
On-Chain Data: A Word of Caution
The on-chain picture introduces one meaningful note of caution. Active addresses today stand at 429,886, below the 7-day average of 458,276 and approximately 9.1% below the 30-day average. Transaction count is also -0.4% versus the 30-day average at 674,847. Network activity, in other words, is not confirming the price resilience with on-chain participation. Hashrate has pulled back as well, sitting at 914.7 EH/s, down 9.9% over 30 days.
Stablecoin market cap at $369.9 billion has held essentially flat over 30 days (up just $0.05 billion), but the 7-day trend shows a slight -$0.21 billion dip. This pool of dry powder has not meaningfully rotated into BTC yet, which means there is latent capital available for a more aggressive leg higher — but it also means the current price action is being driven more by positioning and macro flows than by fresh on-chain demand.

Bull Case vs. Bear Case: A Reference Table
| Scenario | Trigger | Target | Invalidation |
|---|---|---|---|
| Bull Case | Weekly close above $63,200; yield stabilization; ETF inflows resume | $68,200 then $72,800 | Weekly close below $61,400 |
| Bear Case | Weekly close below $63,200; 10Y yield accelerates above 4.70%; dominance breaks | $61,400 then $57,000–$58,000 | Reclaim of $65,800 on volume |
| Near-Term Resistance | Short-term supply zone | $65,800 | — |
My View: The Structure Favors Patience, Not Panic
My read is that this is more likely a launchpad than a trapdoor — but only conditionally. The convergence of three technical frameworks at one support band, combined with BTC dominance holding above 56% through a yield spike that would normally flush the whole sector, is not a coincidence. Institutional money is making a deliberate choice here. The ETF era has changed how Bitcoin responds to macro shocks, and the current response — narrow consolidation rather than a violent flush — is consistent with accumulation at a recognized level. I lean long above $63,200 on a weekly close basis, with the $68,200 target as the first meaningful test of whether this thesis is correct. That said, I am not adding aggressively ahead of U.S. CPI data and earnings season — both of which land this week and could shift yield expectations in either direction rapidly.

Key Levels and Top Movers Summary
| Asset | Price | 24h Change | 7d Change |
|---|---|---|---|
| Bitcoin (BTC) | $63,971 | ▼ -0.37% | ▲ +2.06% |
| Ethereum (ETH) | $1,805.41 | ▲ +0.20% | ▲ +2.38% |
| XRP | $1.097 | ▼ -0.95% | ▼ -3.02% |
| Solana (SOL) | $77.21 | ▼ -1.16% | ▼ -4.09% |
| DeXe (DEXE) | $47.05 | ▲ +25.61% | — |
| Zcash (ZEC) | $528.33 | ▲ +5.25% | — |
Risk Warning: The $63,500–$64,200 confluence zone is a high-probability technical area, but confluence does not guarantee support holds. A sustained move in U.S. 10-year yields above 4.70%, a surprise CPI print to the upside, or a sudden reversal in ETF flows could accelerate a break below $61,400 faster than stop orders can adjust. Position sizing relative to that invalidation level — not the entry price — is the discipline that separates informed risk-taking from gambling.
If you found today’s post helpful, please subscribe and like.
If you’ve been trading without a fee payback, you’ve been losing money this whole time — start getting your trading fees back today.
BingX exchange — maximum fee payback sign-up link:
https://bingx.com/en/rewards?ref=core
Bitunix exchange — maximum fee payback sign-up link:
https://www.bitunix.com/register?vipCode=core
Leave a Reply