
The Most Important Divergence in Crypto Right Now
Bitcoin is trading at $63,674, down a modest 0.36% over the past 24 hours, and most casual observers would look at that price and see relative stability. But beneath the surface, the derivatives market is flashing a signal that deserves serious attention: a long/short ratio of 1.34 with 57.2% of tracked accounts positioned long — yet the perpetual funding rate sits at a barely-there 0.0032%. That gap is not noise. It is the market’s most consequential divergence right now, and understanding what it implies about institutional behavior could determine how traders navigate the next two to three weeks.
When the majority leans long but nobody is willing to pay a meaningful premium to hold that position, what you have is directional bias without conviction. Smart money does not behave this way when it genuinely believes a leg higher is imminent. Historically, elevated funding rates accompany real bull momentum because leveraged longs compete for exposure and bid up carry costs. The near-zero rate we see today suggests institutions are either flat or quietly hedged — leaving retail to hold a tilted book that macro conditions could easily unwind.
Macro Is Not Offering Any Cover
The broader financial environment is actively working against a leveraged long thesis in crypto. The 10-year US Treasury yield jumped 0.66% today to 4.57% — a move that tightens the risk-asset leash in real time. Higher real yields raise the opportunity cost of holding non-yielding assets like Bitcoin and compress the liquidity conditions that typically fuel altcoin speculation. Simultaneously, the dollar index ticked up 0.20% to 101.17, and while that remains historically subdued, an upward-trending DXY combined with rising yields is a classic environment where risk assets struggle to break out.
Equity markets are holding up — the S&P 500 rose 0.42% to 7,575 and the Nasdaq added 0.29% — but that resilience has not translated into crypto inflows. Gold dipped 0.48% to $4,084, suggesting some rotation away from hard assets broadly. The macro backdrop, taken together, does not offer the liquidity tailwind that would justify chasing Bitcoin higher from current levels.
Then there is the stablecoin story. Total stablecoin market cap stands at $369.9 billion, essentially flat over 30 days and down $10 billion from the May peak. Stablecoin supply growth is one of the most reliable leading indicators for crypto market liquidity because it represents dry powder sitting on the sidelines ready to deploy. Contraction — or even stagnation — signals that fresh capital is not entering the ecosystem at a pace that can sustain a breakout. This is not a bullish backdrop for leveraged longs banking on new money to push prices higher.
Open Interest Confirms the Retreat
Open interest fell 0.7% in the past 24 hours. That might sound trivial, but in the context of a market where long accounts outnumber short accounts and funding is effectively zero, it tells a specific story: positions are being reduced, not added. When conviction is high, open interest grows as new money enters. When participants are uncertain, they close out rather than add. The current setup reads as the latter — a quiet de-risking that has not yet shown up dramatically in price but is eroding the structural support beneath it.
Fidelity recently flagged what it described as accumulation-zone signals for Bitcoin, and on a longer time horizon that view has merit. But near-term, the derivatives picture suggests smart money is not in a hurry to chase this level.
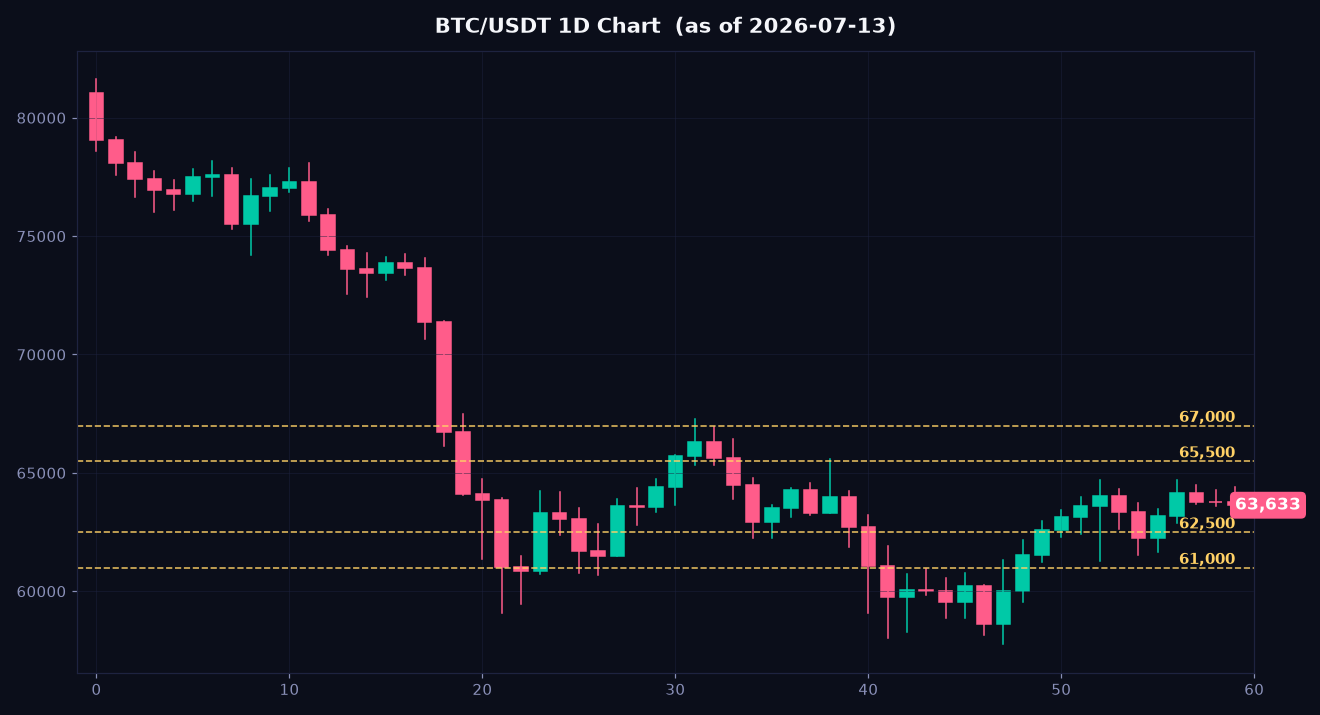
Key levels to watch: $62,500 is the first meaningful support where long liquidations are estimated to cluster, and a breach there could trigger a cascade of forced sells that accelerates downside. $61,000 represents the psychological floor. As the chart shows, Bitcoin has been compressing in a narrow band that is increasingly prone to a volatility event in either direction. To the upside, $65,500 is the first resistance zone, with $67,000 as the level that would meaningfully shift the medium-term technical picture.
On-Chain: Where the Real Demand Signal Lives
The on-chain data is where the institutional positioning lens becomes most revealing. Active addresses today total 384,757 — a figure that sits 17.8% below the 30-day average and well below the 7-day average of 458,018. This is not a one-day blip. The 30-day series shows a clear downward drift from peaks above 560,000 in mid-period to sub-400,000 consistently in recent sessions. Fewer unique participants engaging with the Bitcoin network on a daily basis means organic demand is weakening, not building.
Here is where it gets interesting: transaction count today is 760,744, which is actually 11.7% above its 30-day average. So we have fewer active addresses but more transactions. That divergence typically indicates that existing, larger holders are moving coins between wallets — consolidation activity — rather than new retail participants entering the market. It is a fingerprint of institutional re-positioning, not grassroots accumulation. Mempool conditions confirm this is not a congested network moment; the fast fee sits at just 2 sat/vByte, meaning there is no urgency-driven demand pressure from users competing for block space.
Hashrate continues to climb, reaching 910.3 EH/s, up 6.3% over 30 days. Miner confidence in network security is holding, which is a structural positive — but hashrate is a lagging commitment indicator, not a near-term price catalyst.

The on-chain chart above illustrates the active address trajectory alongside transaction volume. The tx-count vs. address divergence is visible and meaningful. Real demand growth looks like both metrics rising together. What we see instead is a market where the pipes are being used by fewer hands moving larger amounts — consistent with a period of positional adjustment rather than new cycle enthusiasm.
Coiled Spring or Bag-Holding Retail?
This is the central debate. The bull case argues that weak longs will be flushed in a sharp dip to $62,500 or $61,000, after which the sellers are exhausted, short sellers cover, and a genuine rally launches from a cleaner base. It is a coherent thesis, and if spot ETF inflows — which have been the dominant institutional demand vector in 2024 — start to accelerate again, that scenario becomes more plausible.
The bear case, which the current data supports more heavily, is that institutions are simply stepping back while retail holds the long book. The fear and greed index at 28 (Fear), stagnant stablecoin supply, declining active addresses, and a macro environment of rising yields all argue against a near-term breakout. In this reading, the longs that exist are not a coiled spring — they are exposure that has not yet been corrected, and the correction risk rises with every day that macro does not pivot supportive.

Trading Scenarios and Personal Stance
For traders considering positioning, the setup calls for patience over aggression. A long entry below $62,500 with a stop below $61,000 and a target at $65,500 carries a reasonable risk-reward if you believe the flush-and-recover scenario plays out. A short entry on a confirmed break of $62,500 — not before — targets $61,000 initially, with the understanding that a recovery above $63,500 invalidates the thesis. For anyone evaluating which platform to use for perpetuals, fee-payback signup links for BingX and Bitunix are listed at the end of this post.
My personal read: this is not a moment to be a hero on either side. The funding rate divergence is the most honest signal in this market right now, and it says institutional money is not chasing. Until active addresses recover toward the 450,000-plus range, stablecoin supply starts expanding again, or the macro yield picture stabilizes, the path of least resistance remains sideways-to-lower. The coiled spring narrative is appealing but requires evidence that is not yet in the data.
Key Levels and Market Snapshot
| Asset | Price | 24h Change | Note |
|---|---|---|---|
| Bitcoin (BTC) | $63,674 | ▼ 0.36% | Support $62,500 / Resistance $65,500 |
| Ethereum (ETH) | $1,816.44 | ▲ 0.95% | Relative outperformer short-term |
| Solana (SOL) | $77.05 | ▲ 0.67% | Down 5.4% on the week |
| XRP | $1.087 | ▼ 0.73% | Down 5.95% on the week |
| 10Y US Yield | 4.57% | ▲ 0.66% | Key macro headwind for risk assets |
| DXY | 101.17 | ▲ 0.20% | Mild but directional pressure |
Risk warning: Cryptocurrency markets remain highly volatile and leveraged positions can result in rapid, total loss of capital. The scenarios outlined above are analytical frameworks, not financial advice. Always size positions according to your own risk tolerance and never trade with funds you cannot afford to lose entirely. The on-chain and derivatives data cited here reflects a single point in time and can shift rapidly with macro or regulatory catalysts.
If you found today’s post helpful, please subscribe and like.
Real-time briefings and new-post alerts on Telegram: t.me/corecryptoinsights · Follow on X: @core_trading1
If you’ve been trading without a fee payback, you’ve been losing money this whole time — start getting your trading fees back today.
▶ BingX 45% fee payback — full sign-up guide
▶ Bitunix 70% fee payback — full sign-up guide
▶ BingX vs Bitunix — which saves you more?
Leave a Reply