
Bitcoin is holding near $77,577 today — down just 1.51% while the Nasdaq slides 1.03% and the S&P 500 loses 0.71%. With U.S. 10-year Treasury yields punching through 4.8% and geopolitical tensions around U.S.-Iran relations escalating, crypto’s relative resilience against equities is the clearest macro signal of the session.

Bitcoin’s Resilience vs. Equities: What the Numbers Actually Say
On a day when rising yields and geopolitical risk would ordinarily hammer risk assets across the board, Bitcoin is doing something interesting: it is not leading the selloff. The Nasdaq is off 1.03%, the S&P 500 down 0.71%, yet BTC has given back only 1.51% from a higher base. Gold, meanwhile, is up a modest 0.46% to $4,368 — and Bitcoin is roughly tracking that defensive posture rather than the equity tape.
This divergence matters. Institutional desks have spent the last 18 months building the case that Bitcoin can act as a macro hedge under specific conditions: when nominal yields are rising but real rates remain contentious, and when dollar liquidity concerns are genuine rather than temporary. Today fits that template, at least partially. The DXY sits at 99.78, up just 0.11% — not a runaway dollar rally, but a firm one. That firmness is the ceiling for BTC in the near term.
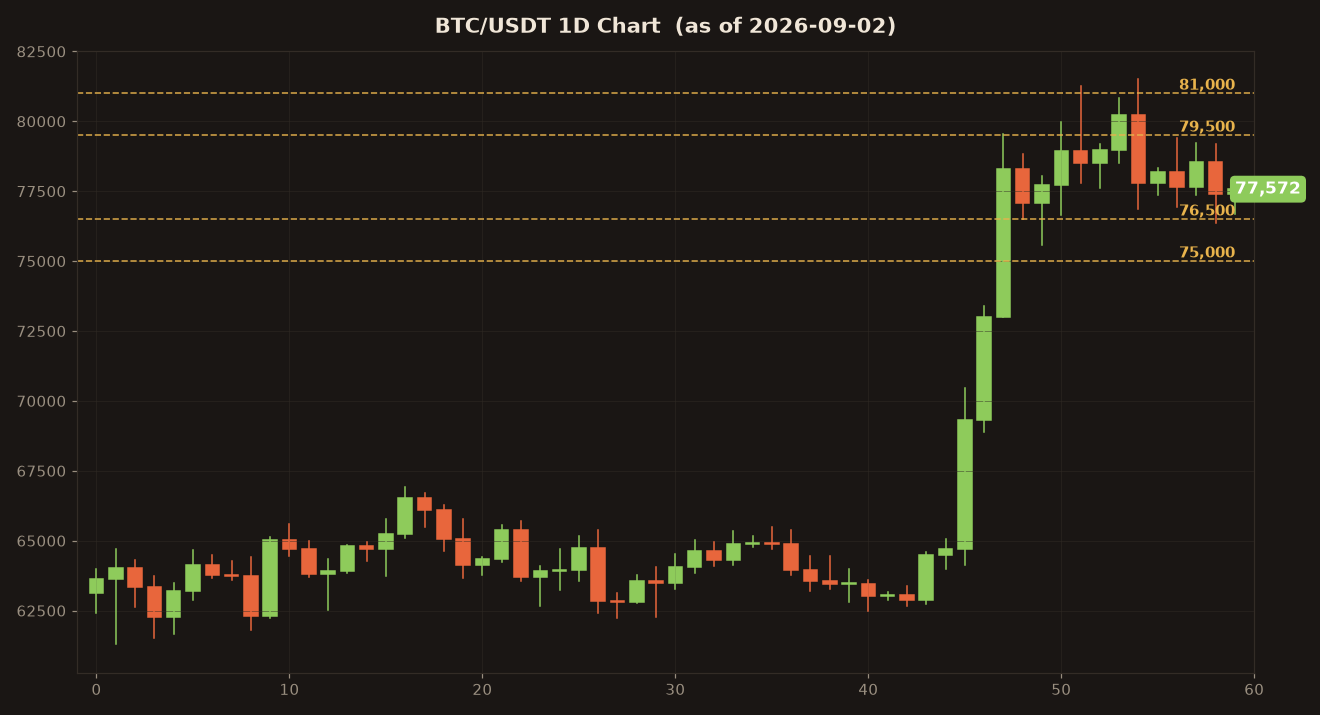
As the chart shows, Bitcoin is compressing within the $76,500–$79,500 range. The $76,500 level is the immediate psychological support traders are watching; a clean break below it opens a retest of the stronger structural floor at $75,000. On the upside, $79,500 is the first meaningful resistance, followed by $81,000. Neither level has been seriously tested today, which itself reflects the low-conviction environment.
What Are Today’s Key BTC Support and Resistance Levels?
The futures market corroborates a wait-and-see posture. Funding rates sit at a near-neutral 0.009%, the long/short ratio is 1.25 — longs modestly dominant but not aggressively so — and open interest has risen only 0.8% over 24 hours. This is not the profile of a market pressing a directional bet. It is a market that is watching macro variables and refusing to overcommit.
| Asset / Level | Support | Resistance | 24h Change |
|---|---|---|---|
| BTC | $76,500 / $75,000 | $79,500 / $81,000 | ▼ -1.51% |
| ETH | $2,350 | $2,500 | ▼ -2.14% |
| SOL | $98 | $105 | ▼ -3.24% |
| XRP | — | — | ▼ -2.80% |
The practical trading scenario: a confirmed hold above $76,500 on any intraday dip sets up a short-term bounce toward the $79,500 resistance. A failure to reclaim $79,500 on any rally attempt — especially if yields stay elevated — keeps the short side of that level tactically valid. Aggressive long extension into macro headwinds would be premature. If you are actively trading these ranges and want to reduce the friction of trading costs, fee-payback referral links for BingX and Bitunix are listed at the end of this post — the BingX referral code guide covering 45% fee payback is worth checking before you size into any position.
Is the DeFi Rotation a Structural Signal or Just Noise?
The session’s most structurally interesting story is not BTC itself — it is what is happening one layer below it. Filecoin (FIL) is up 13.6%, Uniswap (UNI) is up 9.41%, and Curve DAO (CRV) is up 8.48%. Quant (QNT) adds 7.23%. None of these moves have a specific token-level catalyst. There is no major protocol upgrade announced, no airdrop, no exchange listing driving the moves. The catalyst is the rotation itself.
BTC dominance at 59.11% with a Fear and Greed index that has slipped from 69 to 63 tells you what kind of rotation this is: selective, not broad. Capital is not flooding into altcoins indiscriminately — that would show a dominance collapse. Instead, specific DeFi infrastructure names are attracting institutional positioning, likely tied to the regulatory backdrop building quietly in the background.
Consider the structural pieces assembling simultaneously: stablecoin market cap has grown $7.4 billion in 30 days to $387.9 billion. Citi and Goldman Sachs are reportedly joining a stablecoin venture. The SEC is reportedly in discussions around round-the-clock U.S. equity and crypto trading infrastructure. None of these individually move a price chart. Together, they sketch a picture of institutional and regulatory rails being laid for the next phase of on-chain finance — and DeFi protocols like Uniswap and Curve sit directly on those rails.

This is not a call to chase FIL at +13.6% intraday. It is a signal to ask why these names are moving when BTC itself is flat-to-down. The answer, provisionally, is that sophisticated capital is front-running the infrastructure build. If the Bitunix referral program offering 70% fee payback is on your radar for trading DeFi tokens with tighter cost structures, the sign-up details are at the bottom of this post.
On-Chain Data: What Active Addresses and Stablecoin Supply Are Signaling
On-chain metrics add texture to the macro picture. Active Bitcoin addresses today stand at 506,462, above the 7-day average of 481,497 and running approximately 4.9% above the 30-day average. That is a quiet uptick — not a surge, but consistent with the idea that network usage is stable even as price compresses. Transaction count, however, is down 7.4% versus the 30-day average at 627,345, suggesting lower-urgency activity on-chain even as addresses stay engaged.
Hashrate has pulled back 5.7% over 30 days to 888.1 EH/s — a notable but not alarming decline, consistent with minor miner capitulation after the post-halving adjustment period. Mempool fees remain minimal at 1 sat/vbyte, confirming the low-urgency environment.
The stablecoin supply number is the one worth anchoring to. At $387.9 billion — up $1.77 billion in seven days and $7.43 billion in 30 days — the stablecoin pool represents a sizable reservoir of dry powder sitting at the edge of the market. Historical patterns suggest that persistent stablecoin supply growth without a corresponding price rally is a setup for eventual deployment, not a sign of retreat. The 30-day series shows the climb has been steady and uninterrupted, not a single-day spike.

The on-chain chart above visualizes the stablecoin supply trajectory alongside active address trends over the past 30 days — the gradual but consistent accumulation pattern is visible and stands in contrast to BTC’s price compression over the same window.
My Take: The Dollar Index Is the Variable That Resolves This
Here is a direct stance: Bitcoin’s relative outperformance versus equities today is real and meaningful, but it does not yet constitute a directional breakout. The honest interpretation is that BTC is in a holding pattern defined by two opposing forces — a growing on-chain and institutional foundation pushing it higher, and a DXY at 99.78 with yields at 4.8% providing structural headwind. Until one of those forces breaks decisively, the range compresses and traders should treat $76,500 and $79,500 as the boundaries that matter. A DXY rollover below 99 combined with yields pulling back toward 4.5% would be the macro unlock for a credible BTC move higher. A DXY push above 101 would pressure crypto broadly regardless of on-chain fundamentals.
Risk warning: The convergence of elevated U.S. 10-year yields, geopolitical uncertainty around U.S.-Iran tensions, and a firming dollar creates a macro environment where even fundamentally strong assets can experience sharp drawdowns on headline shocks. Open interest growth of only 0.8% signals this market is not positioned for a trend — but it is also one negative macro print away from a disorderly liquidation cascade through the $76,500 support. Position sizing and defined stop-loss levels below $75,000 structural support are not optional in this environment.
FAQ
Why is Bitcoin down today despite holding better than stocks?
Bitcoin is off 1.51% to $77,577 as rising U.S. 10-year yields at 4.8% and U.S.-Iran geopolitical tensions weigh on risk assets broadly — but BTC is outperforming the Nasdaq (-1.03%) and S&P 500 (-0.71%), reflecting its evolving role as a partial macro hedge in institutional portfolios.
What is driving FIL, UNI, and CRV higher today?
Filecoin (+13.6%), Uniswap (+9.41%), and Curve DAO (+8.48%) are surging without token-specific catalysts — the moves reflect selective capital rotation into DeFi infrastructure names, likely connected to the broader regulatory build narrative including the Citi/Goldman stablecoin venture and SEC round-the-clock trading discussions.
What is the stablecoin market cap today and why does it matter?
Stablecoin market cap has reached $387.9 billion, growing $7.43 billion over the past 30 days — this persistent increase represents dry powder on the sidelines and has historically preceded deployment into risk assets when macro conditions improve.
If you found today’s post helpful, please subscribe and like.
Real-time briefings and new-post alerts on Telegram: t.me/corecryptoinsights · Follow on X: @core_trading1
If you’ve been trading without a fee payback, you’ve been losing money this whole time — start getting your trading fees back today.
▶ BingX 45% fee payback — full sign-up guide
▶ Bitunix 70% fee payback — full sign-up guide
▶ BingX vs Bitunix — which saves you more?
Leave a Reply