Bitcoin is falling today because a hotter-than-expected US CPI print (headline +0.4%, core +0.3%) pushed the 10-year Treasury yield to 4.98%, just under the 5% line. The dollar index rose 0.6% and gold dropped 1.83%. BTC slipped 1.23% to about $73,886 in a broad liquidity squeeze rather than a crypto-specific sell-off.

Today’s crypto market is a split screen. On the left, rates and the dollar are draining risk appetite, and Bitcoin is trading below the $75,000 zone it lost before the CPI release. On the right, Wall Street keeps laying crypto plumbing as if the tape didn’t matter. Which side wins over the next few weeks depends on one number: whether the US 10-year yield breaks above 5%.
Why is Bitcoin falling today?
The October CPI report was the trigger. A 0.4% monthly headline gain and 0.3% on core is not what a market pricing in easier policy wanted to see. Bond traders reacted fast. The 10-year yield jumped 2.45% on the day to 4.98%, and the market now treats 5% as a psychological wall.
Bitcoin has been heading lower all week. It is down 4.95% over seven days, and Ethereum has done worse, falling 9.99% to $2,060. Solana lost 10.59% on the week and XRP 16.98%. Even Zcash, one of the cycle’s strongest performers, dropped 9.28% in 24 hours to $1,058. With Bitcoin dominance at 59.79%, capital is retreating toward the largest asset rather than leaving crypto in one wave. Altcoins are still taking the bigger hits.
Recent headlines add to the pressure: reported spot ETF outflows, heavy miner selling before the CPI print, and roughly $1 billion in forced liquidations in a single day when BTC briefly lost $74,000.
Is this a crypto problem or a liquidity squeeze?
Look at what fell together. The S&P 500 slipped 0.38% to 7,520.93. The Nasdaq lost 0.74%. The dollar index climbed 0.6% to 102.26. Gold, which normally benefits when investors get nervous, dropped 1.83% to $4,039.20.
When stocks, gold and crypto fall together while the dollar and yields rise, the market is repricing the cost of money. It is not passing judgment on blockchain. Higher real yields raise the opportunity cost of holding anything that doesn’t pay a coupon, and that hits Bitcoin and gold alike. This matters for how long the drawdown lasts. A crypto-specific crisis can take months to heal. A rate-driven squeeze can reverse within days if the bond market calms down.

The other screen: Wall Street keeps building
While prices bleed, institutional adoption keeps moving. This week alone brought three developments that would have been major headlines in a bull market.
- Charles Schwab adds SOL and LINK. The $13 trillion brokerage expanded its crypto lineup to include Solana and Chainlink. That puts both assets in front of one of the largest retail and advisor client bases in the US.
- Goldman Sachs and Citi reportedly commit $270M to a bank-backed stablecoin venture. This is a signal that big banks want a direct share of onchain dollar issuance rather than leaving it to crypto-native firms.
- Plume and Kimber secure broker-dealer licenses for onchain assets, which opens a regulated path for tokenized securities to be distributed and traded.
None of this moves the price today. Schwab clients buying SOL won’t offset a 5% Treasury yield this week. But these are multi-year decisions made through committees, legal reviews and budgets. Banks don’t commit nine-figure sums to infrastructure they expect to be irrelevant.
Where is the onchain dollar liquidity coming from?
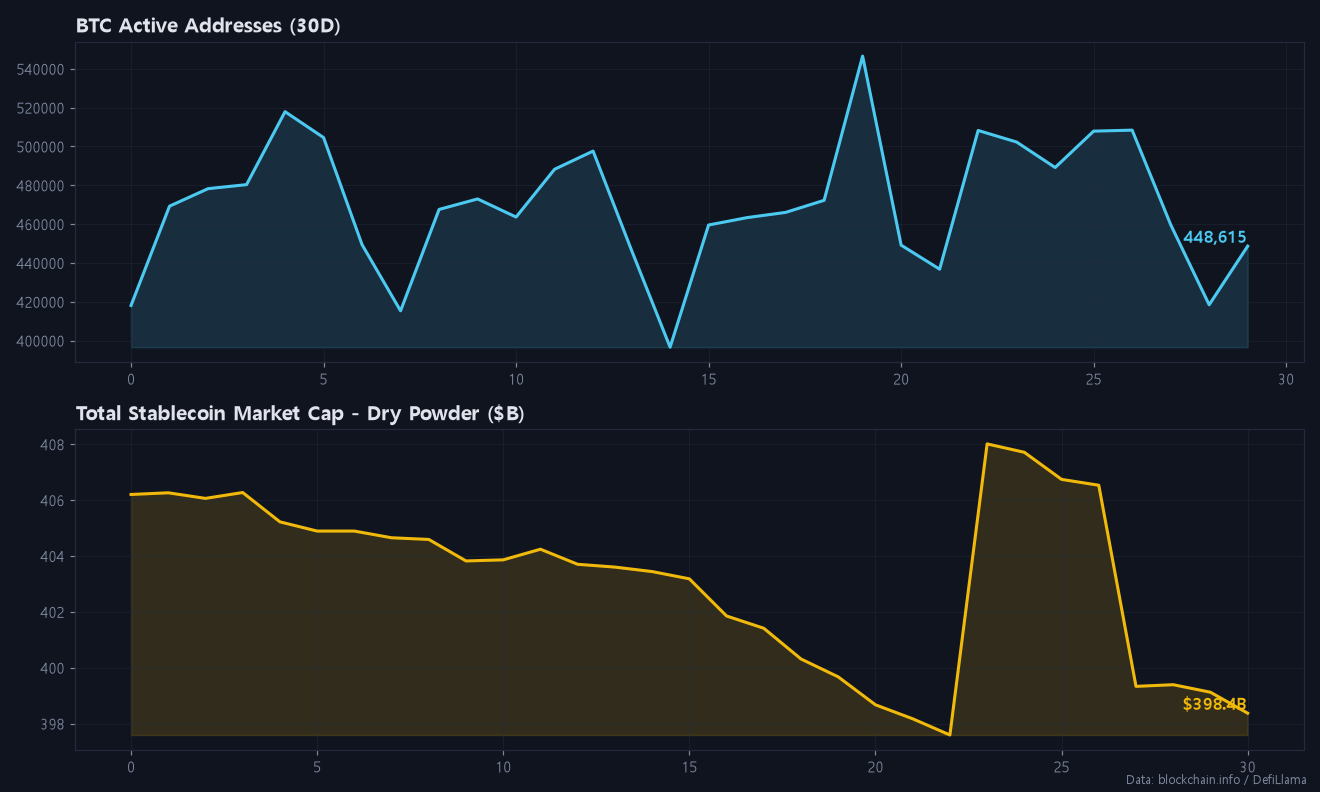
Here is the contradiction. Total stablecoin supply shrank by $9.64 billion over the past week to $398.4 billion, and it is down $7.84 billion over 30 days. Stablecoins are the dry powder of crypto markets. They are the dollars waiting onchain to buy dips, fund margin and supply DeFi liquidity. When that pool contracts, buying power leaves the system.
So banks are preparing to issue onchain dollars at the very moment existing onchain dollars are being redeemed. Two readings are possible. The bearish one: higher Treasury yields make holding non-yielding stablecoins less attractive, and capital is moving back into T-bills and money funds. The bullish one: the current issuers are losing share, and bank-issued stablecoins could eventually become a larger, more regulated source of liquidity. In the near term, the first reading drives price. The second is a 2027 story.
On-chain data: activity is cooling
Network fundamentals line up with the macro picture. Bitcoin active addresses came in at 448,615 today, below the 7-day average of 476,334 and 4.6% under the 30-day average. The 30-day series has swung between roughly 396,000 and 546,000, so today’s reading sits in the lower half. Participation is fading without collapsing.
Transaction count is weaker. At 412,523 it is 37.2% below its 30-day average, which suggests fewer users are moving coins and speculative churn is thinning out. Hashrate stands at 818.7 EH/s, down 20.5% over 30 days. That fits the headlines about miners selling BTC and reporting weaker mining revenue even as production rises. Miners under margin pressure are a steady source of supply until the price recovers.
The stablecoin market cap chart shows a slow decline from about $406 billion to $398.4 billion, interrupted by a brief spike above $408 billion that quickly faded. The chart below shows the full 30-day picture.
What are today’s key BTC support levels?
Bitcoin’s first line of defense is $72,000. Overhead, $75,000 is now resistance. That is the zone BTC lost before the CPI print, and it has to be reclaimed before any bullish argument holds up.
| Asset | Price | 24h | Support | Resistance |
|---|---|---|---|---|
| BTC | $73,886 | ▼ 1.23% | $72,000 | $75,000 |
| ETH | $2,060 | ▼ 3.12% | $2,000 | $2,150 |
| ZEC | $1,058 | ▼ 9.28% | $1,000 / $950 | $1,150–$1,200 |
Ethereum sits only about 3% above its $2,000 psychological floor, with resistance at $2,150. Zcash is holding just above $1,000. If that breaks, $950 is the second support, and sellers are likely to show up again in the $1,150 to $1,200 band.
Futures positioning: longs are piling into a falling market
Derivatives data is the most worrying part of the picture. Open interest rose 3.08% in 24 hours while price fell. Long accounts make up 75.4% of positions, the long/short ratio is 3.07, and funding is still positive at +0.0076%. New longs are being opened into the decline, presumably by traders trying to catch the bottom.
That positioning is fuel for a long-liquidation cascade if yields push through 5%. The roughly $1 billion liquidation day earlier this week shows what happens when crowded longs meet a macro shock.
Trading scenarios: short bias, with a clear exit
My bias is short, selling into rallies. One reason for caution: the Fear & Greed Index has ticked up from 29 to 32. That is still fear, but sentiment is improving at the margin.
- Short setup (BTC): sell rejections in the $74,800–$75,000 area. Invalidation is a sustained close above $75,000. First target $72,000; if it breaks with the 10-year above 5%, let the remainder run.
- Short setup (ETH): sell bounces toward $2,150, stop above that level, target $2,000.
- Bullish flip: if BTC closes and holds above $75,000, close the shorts. A retest of $75,000 that holds as support would be the long entry, with a stop back below $73,886 (today’s price).
If you trade these ranges often, fees add up quickly on short-term entries. Fee-payback signup links are at the end of this post. For details, see this BingX 45% fee payback guide and this Bitunix 70% fee payback sign-up walkthrough.
Will a 5% Treasury yield break the crypto market?
There are two scenarios.
Yield breaks above 5%: In this case, expect the liquidity squeeze to intensify. Leveraged longs get flushed, stablecoin supply keeps shrinking, and Bitcoin tests $72,000 or lower. Institutions likely keep building infrastructure, but their treasury desks won’t buy spot aggressively while T-bills pay this well. Schwab adding SOL helps distribution, not demand on the day.
Yield pulls back below the line: The bond market treats the CPI print as a one-off, the dollar softens, and crypto gets its first sustained relief. In that case the infrastructure news, ignored this week, gets repriced. A reclaim of $75,000 becomes realistic.
My view: the “buy the infrastructure, ignore the tape” thesis is real, but it runs on a timescale of quarters, while yields act on a timescale of days. In the near term the bond market is in control of Bitcoin. I would rather be early to a rebound after $75,000 is reclaimed than catch a falling knife with 75% of the market already long.
Risk warning: Crowded positioning can reverse sharply in either direction. A surprise drop in yields could trigger a short squeeze through $75,000. Size positions conservatively, always use stops, and never risk capital you cannot afford to lose. This is market commentary, not financial advice.
FAQ
Why did Bitcoin drop after the CPI report?
October CPI came in hot at +0.4% headline, which pushed the 10-year yield to 4.98% and the dollar index up 0.6%. That tightened liquidity across risk assets, and BTC fell to about $73,886.
What is Bitcoin’s key support right now?
The main support is $72,000, with resistance at $75,000. A sustained close above $75,000 would weaken the bearish case.
Are stablecoins flowing into or out of crypto?
Out, for now. Total stablecoin supply fell $9.64 billion in a week to $398.4 billion, even as Goldman Sachs and Citi reportedly back a $270M bank stablecoin venture.
If you found today’s post helpful, please subscribe and like.
Real-time briefings and new-post alerts on Telegram: t.me/corecryptoinsights · Follow on X: @core_trading1
If you’ve been trading without a fee payback, you’ve been losing money this whole time — start getting your trading fees back today.
▶ BingX 45% fee payback — full sign-up guide
▶ Bitunix 70% fee payback — full sign-up guide
▶ BingX vs Bitunix — which saves you more?
Leave a Reply