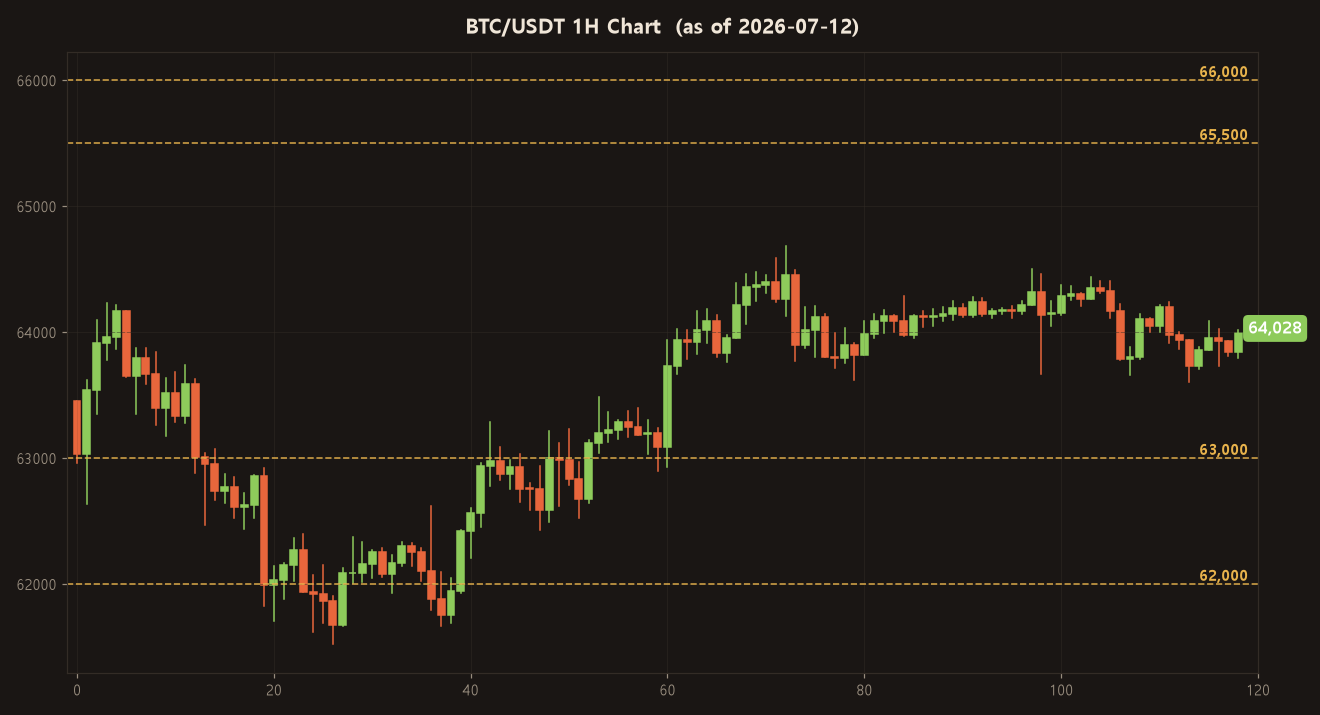
Current Price: $63,990 — Bitcoin is grinding just below its MA20 ($64,042) and MA60 ($64,075), trapped in a narrowing band between the Keltner midline and the 48h swing low at $63,602. Price action lacks conviction in either direction, and the market is clearly digesting the week’s macro inputs before CPI and earnings season land.
Indicator Analysis
Moving Averages
Price sits above MA120 ($63,419) but below both MA20 ($64,042) and MA60 ($64,075), which are themselves converging tightly — a classic compression signal. The short-term averages are offering overhead resistance rather than support, and the mixed alignment suggests no clean trend is in place. Until price reclaims MA60 on a closing basis, bulls have no structural edge.
→ Takeaway: Mixed MA structure favors mean-reversion shorts toward MA120, not momentum longs.
RSI (14)
RSI at 45.3 sits in the lower half of neutral territory — not oversold, but clearly not building bullish momentum. There’s no divergence signal present, and the reading is consistent with a market leaning slightly bearish on the 1H frame. A drop below 40 would open the door to accelerated selling pressure.
→ Takeaway: RSI confirms soft momentum; no reversal signal yet.
MACD
The histogram at -10.0 remains below zero, but the direction is noted as “rising momentum strengthening” — meaning the negative histogram bars are getting smaller, not larger. This is a potential early divergence from pure bearish pressure, though the MACD has not crossed zero. Bears still control the narrative until a zero-line reclaim occurs.
→ Takeaway: MACD histogram improvement is a caution flag for aggressive shorts, but not yet a long signal.
Williams %R
At -38.9, Williams %R is in mid-range — neither overbought nor oversold. This reading rules out a high-probability snap reversal from an exhaustion extreme. The market is simply drifting, with no clear exhaustion on either end of the range currently visible.
→ Takeaway: Neutral Williams %R supports range scalping over directional trend trades.
ATR
ATR stands at $240.1 (0.38% of price), indicating relatively compressed volatility for Bitcoin on the 1H chart. This is meaningful context: tight ATR means stops can be placed more precisely, but also that breakouts, when they come, tend to be sharp and fast. Position sizing should account for a potential volatility expansion.
→ Takeaway: Low ATR environment suits tight-stop scalping; watch for sudden expansion if a key level breaks.
CCI (20)
CCI at -11.0 is essentially flat neutral — marginally below zero but nowhere near the -100 oversold threshold that would signal a tradeable bounce setup. This reinforces the lack of any strong directional conviction from the oscillator suite.
→ Takeaway: CCI is non-committal; wait for a move toward ±100 before using it as a trigger.
Stochastic
Stoch %K (61.1) is above %D (46.4) with a bullish cross in play, which is the one mildly constructive data point in this set. However, the %K reading is not yet in overbought territory, leaving room for a continued drift upward within the range. This lone bullish signal is best treated as a reason to avoid aggressive shorts at the very bottom of the range rather than a green light to go long.
→ Takeaway: Stochastic cross offers a small buffer against shorting near $63,600 support; respect the level.
Keltner Channel
Price is currently below the Keltner midline ($64,001), with the upper band at $64,443 acting as dynamic resistance and the lower band at $63,558 defining downside risk. The positioning below the midline tilts the channel bias bearish on this timeframe. A close above $64,001 would flip Keltner posture neutral.
→ Takeaway: Below Keltner midline = structural short bias; $64,443 upper band is the first meaningful ceiling.

Futures & Positioning
- Funding Rate (0.0065%): Near neutral — longs are paying a minimal premium to hold. This does not signal crowded positioning in either direction, but it does confirm longs remain the slight majority.
- Long/Short Ratio (1.31) | Long Accounts (56.7%): Longs hold a modest edge, but this ratio is not at extremes. A crowded long squeeze is not imminent based on this alone, but longs are statistically the more vulnerable side if support breaks.
- Open Interest Change 24h (-2.47%): This is the most important futures signal today. A meaningful drop in OI alongside sideways price means participants are closing positions, not building new ones. This is a de-risking environment — not the setup for a sustained directional move.
- Fear & Greed Index (26 — Fear): Unchanged from yesterday at deep Fear territory. Sentiment has not recovered despite the small price bounce off lows. Historically, sustained Fear readings can precede relief rallies, but the absence of improvement day-over-day suggests no panic buying is stepping in yet.
Today’s Position Strategy
⭐ PRIMARY: Short Scalp Setup
With OI declining, price below all key short-term MAs, below the Keltner midline, and RSI trending soft, the path of least resistance on the 1H is lower. A bounce into the $64,050–$64,200 rejection zone — confluence of MA20, MA60, and the Keltner midline — offers a clean risk/reward short entry. The declining OI confirms this is a position-unwinding environment, not one where new longs are being aggressively added.
| Parameter | Short Setup |
|---|---|
| Entry Zone | $64,050 – $64,200 (MA20/MA60/Keltner mid confluence) |
| Target 1 | $63,600 (48h swing low / Keltner lower band) |
| Target 2 | $63,100 (midpoint of key support zone) |
| Stop / Invalidation | $64,500 (above Keltner upper band, ~$300 risk) |
SECONDARY: Long Scalp / Watch Setup
A long is only warranted on a confirmed flush and hold of the $62,000–$63,000 support zone. Do not pre-position long here — wait for price to reach the zone, show a rejection candle, and confirm with RSI divergence or a Stochastic cross. A directional long above current levels without that confirmation risks buying into further distribution.
| Parameter | Long Setup |
|---|---|
| Entry Zone | $62,100 – $62,500 (support zone, only on confirmed wick rejection) |
| Target 1 | $63,400 (MA120 / Keltner lower band) |
| Target 2 | $64,000 (Keltner midline reclaim) |
| Stop / Invalidation | $61,800 (below weekly support base) |
This is technical analysis prepared for educational purposes and is not financial advice — trade sizing and risk management remain your responsibility.
Bottom line: Bitcoin is a seller’s market at $64,050–$64,200 today — fade the bounce, protect below $61,800, and let the CPI print decide the next real move.
If you found today’s post helpful, please subscribe and like.
If you’ve been trading without a fee payback, you’ve been losing money this whole time — start getting your trading fees back today.
BingX exchange — maximum fee payback sign-up link:
https://bingx.com/en/rewards?ref=core
Bitunix exchange — maximum fee payback sign-up link:
https://www.bitunix.com/register?vipCode=core
Leave a Reply