BTC is trading at $58,292 on the 1H chart after losing the $60K round number for the first time in four months. Price sits below every major moving average, close to the 48h and 7d swing low of $57,700. The range has compressed from a 7-day high of $68,466 into a steady sell-off, now in its sixth straight weekly decline. This is the longest losing streak since 2022.

Macro is adding pressure. The Nasdaq fell 5.28% and the S&P 500 dropped 3.7% on the day. Gold also fell 4.29%, which looks like broad cash-raising rather than a rotation into havens. The dollar index was flat at 103.86. Fee-payback sign-up links for BingX and Bitunix are at the end of the post.
Indicator Analysis
Moving Averages
Price trades below MA20 ($60,784), MA60 ($62,310) and MA120 ($63,472). The averages are stacked in bearish order, with the short MA below the long. MA20 is roughly 4% above spot and is the first realistic magnet for any relief rally. That also makes it the first place sellers are likely to reload.
→ Trend structure is bearish. Bounces into $60.8K are selling opportunities until proven otherwise.
RSI
RSI(14) reads 17.5, which is deep oversold territory on the hourly chart. Readings this low often come before a short-term reflex bounce. In a strong trend, however, RSI can stay pinned below 30 while price keeps grinding lower.
→ Oversold, but not a buy signal by itself. Avoid opening fresh shorts at the lows.
MACD
The histogram is at -289.5, below the zero line. Its direction shows bullish momentum building, meaning the bars are shrinking from more negative levels. Downside momentum is decelerating even though the trend has not flipped.
→ Early sign of a relief bounce. A move above zero is needed before talking about reversal.
Williams %R
Williams %R sits at -87.2, inside the oversold zone below -80. Price is closing near the bottom of its recent range, which confirms seller control. The reading also says the move is stretched.
→ Stretched to the downside. Short entries are better taken higher.
ATR
ATR(14) is $838.5, or 1.44% of price, so hourly swings of $800 or more are normal right now. That volatility defines stop distance. Anything tighter than about one ATR risks getting clipped by noise.
→ Size positions so a $850 to $1,200 stop fits your risk budget.
CCI
CCI(20) prints -124, below the -100 threshold that marks a strong downside deviation from the mean. The reading aligns with trend continuation rather than exhaustion. The level is not extreme enough to call a washout.
→ Bearish deviation confirmed. No capitulation signal yet.
Stochastic
%K is 12.8 and %D is 15.6, both in oversold territory, with %K still under %D. A bullish cross from this zone would be the first trigger for a short-covering pop. It has not happened yet.
→ Watch for a %K cross above %D as the bounce trigger. Until then, no long.
Keltner Channel
Price is hugging the lower Keltner band at $58,382, with the midline at $60,371 and the upper band at $62,360. The Bollinger lower band sits slightly below at $57,822 inside an expanding 9.75% width. Expansion means volatility is rising with the trend, not fading. ADX at 56.7 confirms a strong trend.
→ Band-walking in a strong trend. The Keltner midline near $60.4K is the logical mean-reversion target and short zone.

On-Chain & Positioning
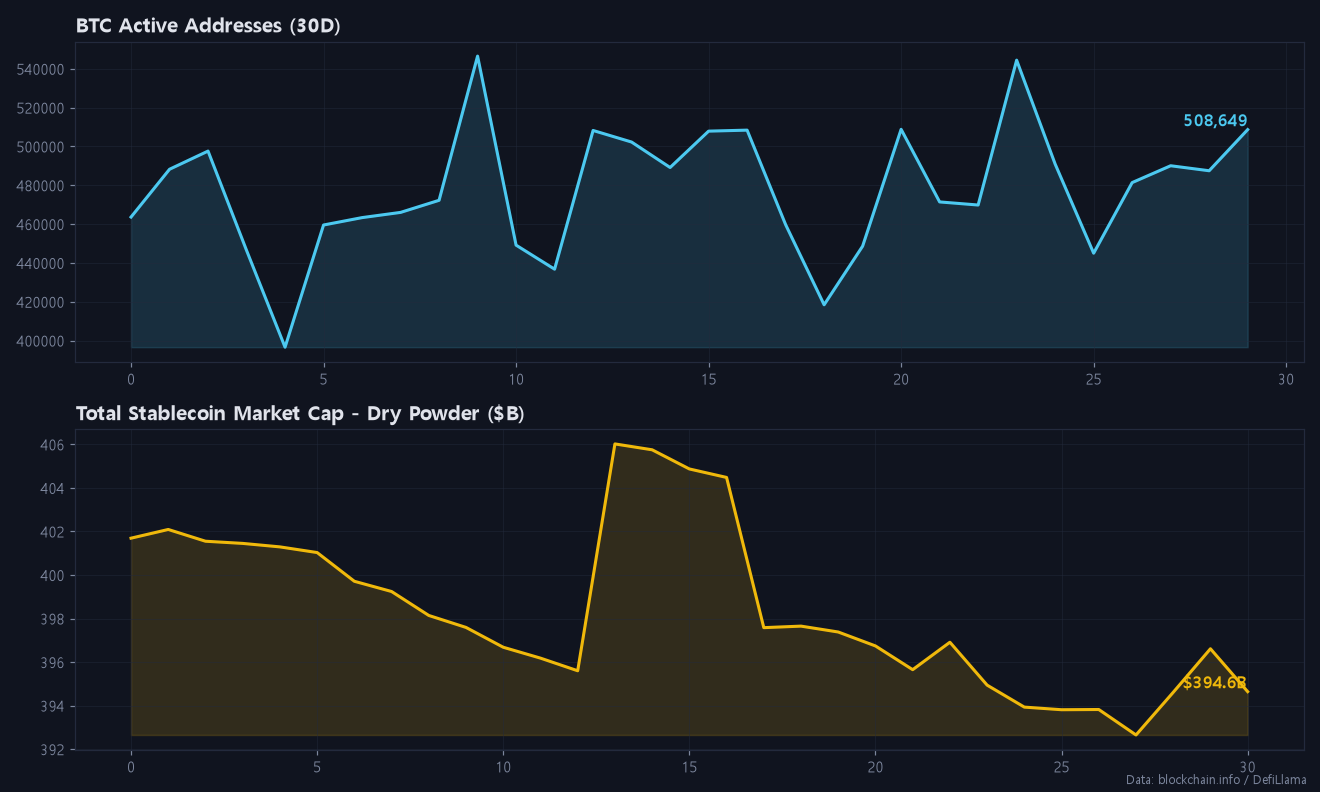
Active address, stablecoin supply and hashrate readings were not included in today’s data feed, so the chart below serves as the on-chain reference. On the hourly tape, OBV fell by 98,416 BTC over 24 hours, showing distribution. MFI at 23.1 points to money flowing out rather than dip-buying.

- Funding rate: -0.0047%. This is slightly negative, so shorts are paying longs. Larger players appear to be positioned short.
- Long/short ratio: 3.43, with 77.4% of accounts long. Retail is heavily skewed toward catching the bottom.
- Open interest: -0.89% over 24h. Despite a four-month low in price, very little leverage has been flushed. That leaves liquidation fuel below $57.7K.
- Fear & Greed: 12 (Extreme Fear), up slightly from 10. Sentiment is washed out, but positioning is not.
The mismatch matters. Extreme fear on the index coexists with 77% of accounts long and barely shrinking open interest. That is not how real bottoms usually look.
Korean premium is also worth watching. Upbit trades at ₩80,692,000 with a 3.82% kimchi premium. The global-equivalent level is near ₩78 million, so a premium squeeze would add further downside for KRW holders.
Today’s Position Strategy
SHORT Setup (Primary)
| Item | Level |
|---|---|
| Entry zone | $60,000 – $60,900 |
| Target 1 | $58,400 |
| Target 2 | $57,700 |
| Target 3 | $56,000 |
| Stop (invalidation) | $61,800 |
The entry zone clusters several resistance levels:
- The $60K psychological level
- Ichimoku cloud bottom ($60,043) and Kijun ($60,158)
- Keltner midline ($60,371) and 24h VWAP ($60,446)
- MA20 ($60,784) and cloud top ($60,878)
The stop sits about one ATR above the cloud top. A clean hourly hold above it would mean the bounce has real buyers behind it. Targets step down through the lower Keltner band and the swing low toward the $56K first support, where crowded longs would likely be forced out.
LONG Setup (Secondary, Conditional)
| Item | Level |
|---|---|
| Entry zone | $56,000 – $56,600 |
| Target 1 | $57,800 |
| Target 2 | $58,400 |
| Target 3 | $60,000 |
| Stop (invalidation) | $55,100 |
Only consider this setup if the flush into $56K arrives with true capitulation. That means open interest dropping 5% or more and long accounts falling below 65%. Oversold RSI, Stochastic and Williams %R give the bounce potential, and the shrinking MACD histogram supports it. The stop sits roughly one ATR under $56K.
If support fails, the next zone is $52,500–$53,000. That area marks the extension of Peter Brandt’s bearish pattern, and the long idea is off if price gets there.
This is market analysis, not financial advice. Size every trade so a stop-out is a routine loss, not an account event.
Conclusion: The trend is down and the leverage flush hasn’t happened yet, so sell bounces into $60K–$60.9K and only buy $56K if open interest and long share collapse first.
If you found today’s post helpful, please subscribe and like.
Real-time briefings and new-post alerts on Telegram: t.me/corecryptoinsights · Follow on X: @core_trading1
If you’ve been trading without a fee payback, you’ve been losing money this whole time — start getting your trading fees back today.
▶ BingX 45% fee payback — full sign-up guide
▶ Bitunix 70% fee payback — full sign-up guide
▶ BingX vs Bitunix — which saves you more?
Leave a Reply