Bitcoin is falling today because it lost its long-term $65K support during a broad risk-off session. BTC trades near $61,563, down 13.4% in a week, as the S&P 500 fell 2.0% and the US 10-year yield held at 5.05%. The prior range projects a measured move toward roughly $59K.

This is a top-down look at the breakdown. It starts with the macro trigger, moves to the weekly structure and the levels sellers are likely to defend, and then checks the institutional picture and futures positioning. It ends with a scenario map you can trade against. Bitcoin did not collapse on a single headline. Several pressures lined up, and the chart gave way when they did.
What triggered the Bitcoin sell-off?
The trigger came from outside crypto. US equities had a clean risk-off day: the S&P 500 fell 2.02% to 7,175.83 and the Nasdaq lost 2.25% to 23,879.2. When high-beta tech sells off that hard, crypto rarely escapes, and Bitcoin has traded as a leveraged Nasdaq proxy for most of this cycle.
The rate backdrop makes it worse. The US 10-year yield edged lower on the day but still sits at 5.05%. A risk-free return above 5% raises the opportunity cost of holding a volatile asset with no yield. The dollar index was flat at 103.93, so this was not a dollar squeeze. It was a straightforward repricing of risk.
Gold also fell 2.35% to $3,653.9. When the classic hedge drops alongside equities, it usually means investors are raising cash across the board, not rotating from one asset to another. That kind of selling hits everything that is liquid, and crypto is very liquid.
Breakdown anatomy: the weekly chart
The $65K–$71K range and the failed support
For weeks, BTC moved inside a range of roughly $65K to $71K. Multiple desks treated $65K as the long-term support that kept the broader structure intact. This week that floor gave way, and price has not reclaimed it since. Once a level that many traders watch is broken, it usually turns from support into resistance, because trapped longs use any bounce back to it as a chance to exit near breakeven.
The measured-move target near $59K
A standard measured move takes the height of the range, about $6K, and projects it down from the breakdown point. That gives a target near $59K. It sits just under the psychological $60K handle, which creates a confluence zone between $58.5K and $60K. When a technical projection lines up with a round number, the market tends to test it. Whether it holds is another question, but the test itself looks likely.
As the chart shows, the candles since the breakdown have printed lower highs below $65K, and there has been no strong reclaim attempt yet.

Where is Bitcoin resistance now? The sell-the-rip map
Measured from the range high near $71K to this week’s low around $61.5K, the Fibonacci retracements line up neatly with the broken support:
- $65.2K (38.2%) – first resistance, almost exactly on the old $65K floor. This is the most obvious place for sellers to reload.
- $66.3K (50%) – second resistance and the midpoint of the decline.
- $67.4K (61.8%) – the trend-change line. A daily close above it would invalidate the breakdown thesis.
Until price closes back above that 61.8% level, I treat each of these as a sell-the-rip zone rather than a sign of recovery. ETH at $1,746.87, down 12.77% on the week, is following BTC closely. If $60K fails, beta names like ETH, SOL (down 10.6% weekly) and BNB (down 11.38%) are likely to amplify the move.
Institutional cross-check: bearish consensus vs. holder conviction
The institutional backdrop supports what the chart shows. Citi cut its Bitcoin target and now says BTC will not reach $100K within a year. Cowen warned of one more flush before a durable bottom. October data showed institutional exposure fell about 10%, mostly because prices fell rather than because funds sold heavily. That detail matters. Positions shrank in dollar terms, but there was no mass exit. The flip side is that underwater holders who have not sold yet are still potential sellers.
The counter-signal comes from Trump Media, which is restructuring $884M of debt without selling its BTC. That suggests corporate treasury holders are not capitulating. They are absorbing pain, not dumping coins. In short, sell-side strategists are bearish, while balance-sheet holders are holding firm. That combination usually produces grinding ranges and sharp flushes rather than a clean trend reversal.
What does futures positioning say about the Bitcoin bottom?
This is where the setup looks most uncomfortable for bulls. The Fear & Greed Index is at 10 (Extreme Fear), but derivatives traders are still leaning long:
- Long accounts: 76.5% (long/short ratio 3.26)
- Funding rate: +0.0079%, still positive
- Open interest: up 0.99% over 24 hours
Real bottoms usually come after funding turns negative and open interest drops sharply as longs are forced out. We have not seen that yet. Crowded longs above a known downside target act like fuel, and the $58.5K–$60K zone is where that fuel would likely ignite.
Because positioning is crowded, slippage and fees during a liquidation cascade can eat into returns quickly. Fee-payback signup links are at the end of this post for anyone reviewing their trading costs. You can also read the BingX fee payback guide or the Bitunix referral code and fee rebate walkthrough.
On-chain data: network health under the price drop
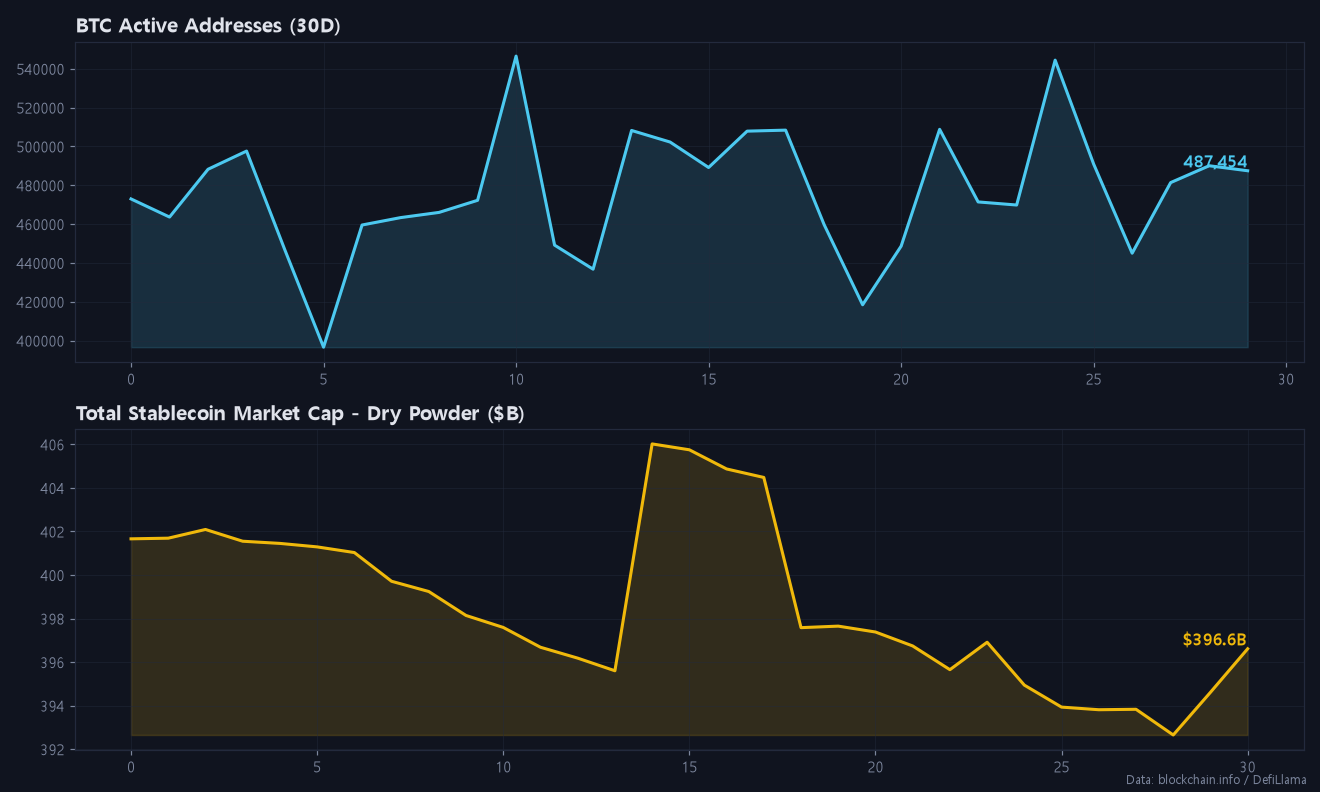
The on-chain picture is mixed but not panicked. Active addresses are at 487,454, in line with the 7-day average of 486,993 and 2.3% above the 30-day average. Transaction count reached 674,354, 8.1% above its 30-day average. Activity often picks up during sell-offs as coins move, and that appears to be part of what is happening here.
The more cautious signal is stablecoin liquidity. Total stablecoin market cap is $396.6B, down $5.05B over 30 days and $0.3B over the past week. That pool is the market’s dry powder, and it is shrinking slightly rather than building up for a dip-buying wave. Hashrate is 1,052.2 EH/s, down 8.7% over 30 days, which hints at miner margin pressure at lower prices. Mempool fees are just 4 sat/vB, so the network is not congested by panic transfers.
The on-chain chart below shows activity holding steady while stablecoin supply drifts lower. Users are still on the network, but new capital is not rushing in.
Scenario table: what are today’s key BTC levels?
| Scenario | Trigger | Path / Target |
|---|---|---|
| Bear ▼ | Daily close below $60K | Long-liquidation flush → $58.5K measured-move zone |
| Base → | Holds $60K, rejected at $65.2K | Choppy range between $60K and $65K |
| Bull ▲ | Daily close above $67.4K | Breakdown invalidated; retest of the $71K range high |
Concrete trade framework
- Short (preferred): sell bounces into $65.2K–$66.3K. Stop on a daily close above $67.4K. Targets are $60K, then $58.5K.
- Long (reactive only): consider re-entry inside $58.5K–$60K, but only after a visible flush with funding turning flat or negative and open interest dropping. Stop below $57.8K. Target is $63K–$65K.

My view
I am short-biased and selling rallies. Extreme fear on its own is not a buy signal when 76.5% of accounts are still long and funding is positive. The crowd is scared, but it has not been forced out yet. Add a Nasdaq down 2.25% and yields above 5%, and I would rather fade a bounce near $65K than try to catch the knife. My plan is to wait for the flush into $58.5K–$60K, see longs get liquidated, and only then look at the long side. Trump Media’s decision to hold its BTC tells me the eventual bottom may be firm. It does not tell me the bottom is in yet.
Risk warning: crowded positioning can work in both directions. A surprise drop in yields or a sharp equity rebound could squeeze shorts through $65K quickly. Size positions so that a stop at $67.4K is survivable, and avoid high leverage while volatility is this elevated. None of this is financial advice.
FAQ
Why is Bitcoin down this week?
BTC lost its $65K long-term support during a risk-off day in which the S&P 500 fell 2.02% and the 10-year yield held at 5.05%. That pushed it down 13.4% in a week to about $61,563.
What is the next Bitcoin support level?
The psychological $60K level comes first, followed by the $58.5K–$59K measured-move target projected from the prior $65K–$71K range.
What would turn Bitcoin bullish again?
A daily close above $67.4K, the 61.8% Fibonacci retracement, would invalidate the breakdown and reopen the path toward $71K.
If you found today’s post helpful, please subscribe and like.
Real-time briefings and new-post alerts on Telegram: t.me/corecryptoinsights · Follow on X: @core_trading1
If you’ve been trading without a fee payback, you’ve been losing money this whole time — start getting your trading fees back today.
▶ BingX 45% fee payback — full sign-up guide
▶ Bitunix 70% fee payback — full sign-up guide
▶ BingX vs Bitunix — which saves you more?
Leave a Reply