BTC is trading at $69,163.2 after losing the $70K handle. That move confirms the lower-high, lower-low structure that took price from the 7-day high of $76,350.9 down to a 48-hour low of $67,449.0. Price sits below every major moving average on the 1H chart, and the bounce off the low has so far stalled under the $70K psychological level.

Indicator Analysis
Moving Averages
The MA20 ($70,872.1), MA60 ($72,836.5) and MA120 ($73,830.1) are in full bearish alignment, and price sits below all three. The MA20 is about 2.5% overhead and marks the first layer of dynamic resistance. As long as price stays under it, rallies are corrective rather than trend-changing.
→ Trend structure is bearish. The $70.9K MA20 is the first ceiling to watch.
RSI
RSI(14) reads 23.4, which is in oversold territory. In a trend with an ADX above 70, oversold readings can persist, so this does not work as a buy signal on its own. It does mean fresh shorts at current prices carry poor risk-reward compared with selling a bounce.
→ Oversold, but in a strong trend. Don’t chase shorts here, and don’t treat this as a bottom call.
MACD
The MACD histogram is at -201.7 and still below the zero line. Its direction is improving, which means bearish momentum is fading at the margin. Combined with the oversold RSI, this supports a relief bounce toward resistance rather than an immediate continuation lower.
→ Bearish momentum is easing. A bounce is plausible before the next leg.
Williams %R
Williams %R sits at -62.7. That is weak but no longer in the oversold zone below -80, so price has already recovered somewhat from the extreme of its recent range. There is still room to rise before reaching overbought levels.
→ Mid-to-lower range reading that leaves room for a bounce.
ATR
ATR(14) is $697.9, about 1.01% of price per hourly candle. Stops tighter than one ATR are likely to get clipped by normal noise. The setups below use roughly 1.5 to 2 ATR of buffer beyond key structure.
→ Expect about $700 swings per hour, and size positions so a $1,400 adverse move is survivable.
CCI
CCI(20) is at -103.1, just below the -100 threshold. That confirms price is stretched below its statistical mean. Readings like this in a downtrend often precede a mean-reversion move toward the midline, which sits near $70.6-70.9K.
→ Stretched to the downside, and the mean-reversion target lines up with resistance.
Stochastic
Stochastic %K (37.3) has crossed above %D (28.6) after coming up from lower levels. That is an early bullish cross in the short-term oscillator. It supports the idea of a near-term bounce, though it is far from overbought confirmation.
→ The short-term bullish cross favors a bounce into resistance.
Keltner Channel
Price is hugging the lower Keltner band at $68,975.5. The midline is $70,656.0 and the upper band is $72,336.4. The Bollinger Bands are expanding (width 7.55%), with the lower band at $68,197.4, which shows volatility is opening up in the direction of the trend. A return to the Keltner midline is the natural bounce target, and the upper band near $72.3K caps any stronger rally.
→ The lower band is being tested. The $70.6K midline is the most likely bounce destination.

On-Chain & Positioning
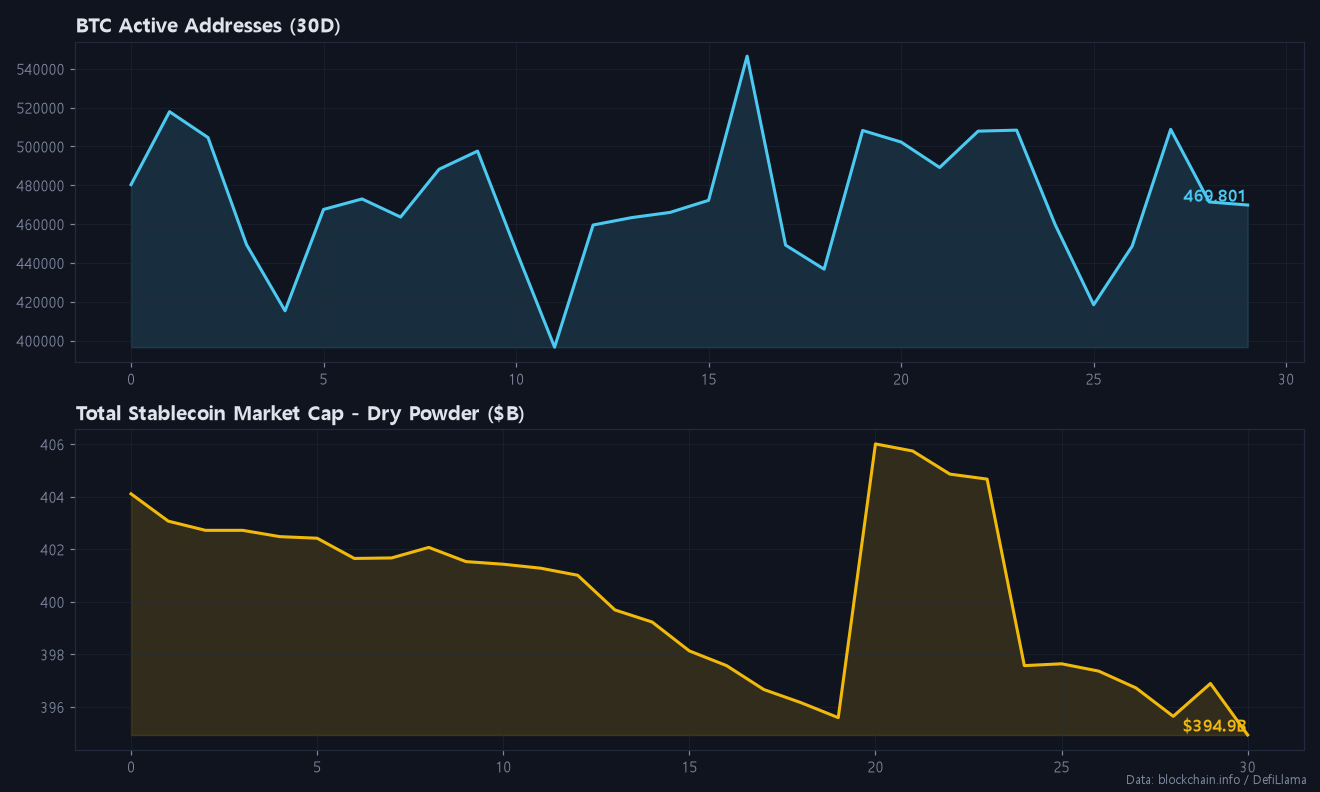
Stablecoin liquidity is a headwind. Stablecoin outflows are reducing the dry powder available to absorb selling, and headlines are flagging the market’s biggest liquidity warning since 2022. OBV over the last 24 hours shows distribution, with a delta of -143,839 BTC. MFI(14) is at 16.5, meaning money is still leaving even as price nears oversold levels. The VWAP(24) at $70,587.6 sits 2.02% above price, so sellers have controlled the session’s volume-weighted average.

- Funding rate: 0.0026%. Effectively flat, so longs are not paying up despite their crowding.
- Long/short ratio: 3.42, with 77.4% of accounts long. Retail is heavily positioned for a bounce, which is a classic setup for further long liquidations.
- Open interest (24h): +3.54%. OI rising while price falls points to new longs being added into the decline, and these positions are now trapped.
- Fear & Greed: 20 (Extreme Fear), down from 28. Sentiment is washed out, yet positioning is still long-heavy. Both conditions rarely mark a durable bottom together.
On the macro side, the US 10-year yield has jumped to 5.1% (+2.1% on the day). The S&P 500 (-0.35%) and Nasdaq (-0.39%) slipped, while gold rose 0.57%. The Korean premium sits at 1.84%, with BTC at ₩93.94M, still above the ₩90M psychological support.
Today’s Position Strategy
SHORT Setup (Primary)
| Item | Level |
|---|---|
| Entry zone | $70,000 – $71,000 (on a bounce) |
| Target 1 | $68,200 (Bollinger lower band) |
| Target 2 | $66,800 (1st support, below 48h low $67,449) |
| Invalidation | 1H close above $72,500 |
The $70-71K zone stacks the most resistance on the chart: the $70K psychological level, the cloud bottom ($70,031), the Kijun ($70,578.8), the 24h VWAP ($70,587.6), the Keltner midline ($70,656.0) and the MA20 ($70,872.1). Positioning is long-heavy at 77.4% and open interest is growing into the decline, so a rejection there could trigger a cascade of long stops toward $66.8K. A close above $72.5K would put price above the Keltner upper band and near the MA60, which breaks the bearish structure.
LONG Setup (Secondary, counter-trend)
| Item | Level |
|---|---|
| Entry zone | $66,800 – $67,450 (sweep of 48h low into support) |
| Target 1 | $69,480 (Tenkan-sen) |
| Target 2 | $70,600 (VWAP / Keltner midline) |
| Invalidation | 1H close below $65,800 |
RSI at 23.4, CCI below -100, MFI at 16.5 and a fresh stochastic bullish cross all point to an oversold market that could snap back sharply. Wait for a liquidity sweep of the $67,449 low into $66.8K support rather than buying here. This trade runs against an ADX of 72.2, so keep it small and take profits quickly. The stop sits about 1.5 ATR under support and above the $65K second support zone.
This is market analysis, not financial advice. Size every trade to an amount you can afford to lose. If you trade these setups, fee-payback signup links for BingX and Bitunix are at the end of this post.
Conclusion: the trend, flows and crowded longs favor selling a $70-71K bounce toward $66.8K, with $72.5K as the line that cancels the bearish view.
If you found today’s post helpful, please subscribe and like.
Real-time briefings and new-post alerts on Telegram: t.me/corecryptoinsights · Follow on X: @core_trading1
If you’ve been trading without a fee payback, you’ve been losing money this whole time — start getting your trading fees back today.
▶ BingX 45% fee payback — full sign-up guide
▶ Bitunix 70% fee payback — full sign-up guide
▶ BingX vs Bitunix — which saves you more?
Leave a Reply