BTC is trading at $68,576.4 on the 1H chart after a sharp drop from the 48-hour high of $74,529.7 to an intraday low of $67,449.0. Price is still below every major moving average. The broken $70K level now acts as overhead resistance, and the market is coiling in a tight Bollinger squeeze just above the lows.

Risk appetite is weak across markets. The Nasdaq fell 0.91%, the S&P 500 slipped 0.4% to 7,561.67, the dollar index rose to 103.43 and the US 10-year yield sits at 5.15%. Headlines point to ETF outflows and roughly $1.3B in forced liquidations during the slide into the $67K area.
Indicator Analysis
Moving Averages
The MA20 is at $68,967.8, the MA60 at $71,722.9 and the MA120 at $73,036.6. That is a clean bearish stack with price below all three. The MA20 sits only about $390 above price and is the first ceiling. The MA60 and MA120 line up with the $72K–73K zone, where any larger relief rally should stall.
→ Trend structure is bearish. Rallies into the MAs are selling opportunities until price reclaims the MA60.
RSI
RSI(14) reads 50.4, which is neutral. It has recovered from the selloff without reaching overbought, so the drop has been partly digested while price is still pinned near the lows. RSI is neither oversold nor showing strength.
→ RSI gives no edge on its own. There is room for a bounce, but nothing confirms a reversal.
MACD
The MACD histogram is +112.9, but the MACD lines remain below the zero line and the momentum read is still classed as bearish (maintained or strengthening). A positive histogram below zero usually marks a relief phase inside a downtrend, not a trend change. Until the lines cross back above zero, the larger momentum regime stays negative.
→ This is a bear-market bounce signal at best. It is not a long trigger.
Williams %R
Williams %R is at -76.2. Price is closing in the lower quarter of its recent range, just shy of the -80 oversold threshold. Sellers still control where candles close.
→ Pressure is near oversold but not exhausted. Watch for a push below -80 followed by a hook back up.
ATR
ATR(14) is $509.7, or 0.74% of price. That is moderate hourly volatility, consistent with the current squeeze. One ATR is about $510 and two ATR about $1,020. These figures are the basis for the stop buffers below.
→ Size positions so a 2 to 5 ATR adverse move does not wipe out the account. A squeeze breakout can expand ATR quickly.
CCI
CCI(20) prints -68.8. It is below zero but well above the -100 extreme. This confirms below-average price action without a capitulation reading.
→ The bias is mildly bearish, and there is room for another leg down before CCI looks stretched.
Stochastic
%K is 23.8 and %D is 37.5. %K is below %D and heading toward the oversold zone. The short-term oscillator is still rolling over rather than turning up.
→ There is no bullish cross yet. A %K cross above %D under 20 would be the first sign that a bounce is setting up.
Keltner Channel
The Keltner midline is $69,354.7, the upper band $70,448.1 and the lower band $68,261.3. Price is hugging the lower band, which is typical of a strong trend. ADX at 38.0 confirms the trend is strong. The Bollinger Bands show the same picture: width is only 2.45%, the lower band is at $68,123.5 and price is below the midline.
→ The $68.1K–68.3K band floor is the near-term pivot. A close below it opens the move back to $67.4K.

On-Chain & Positioning
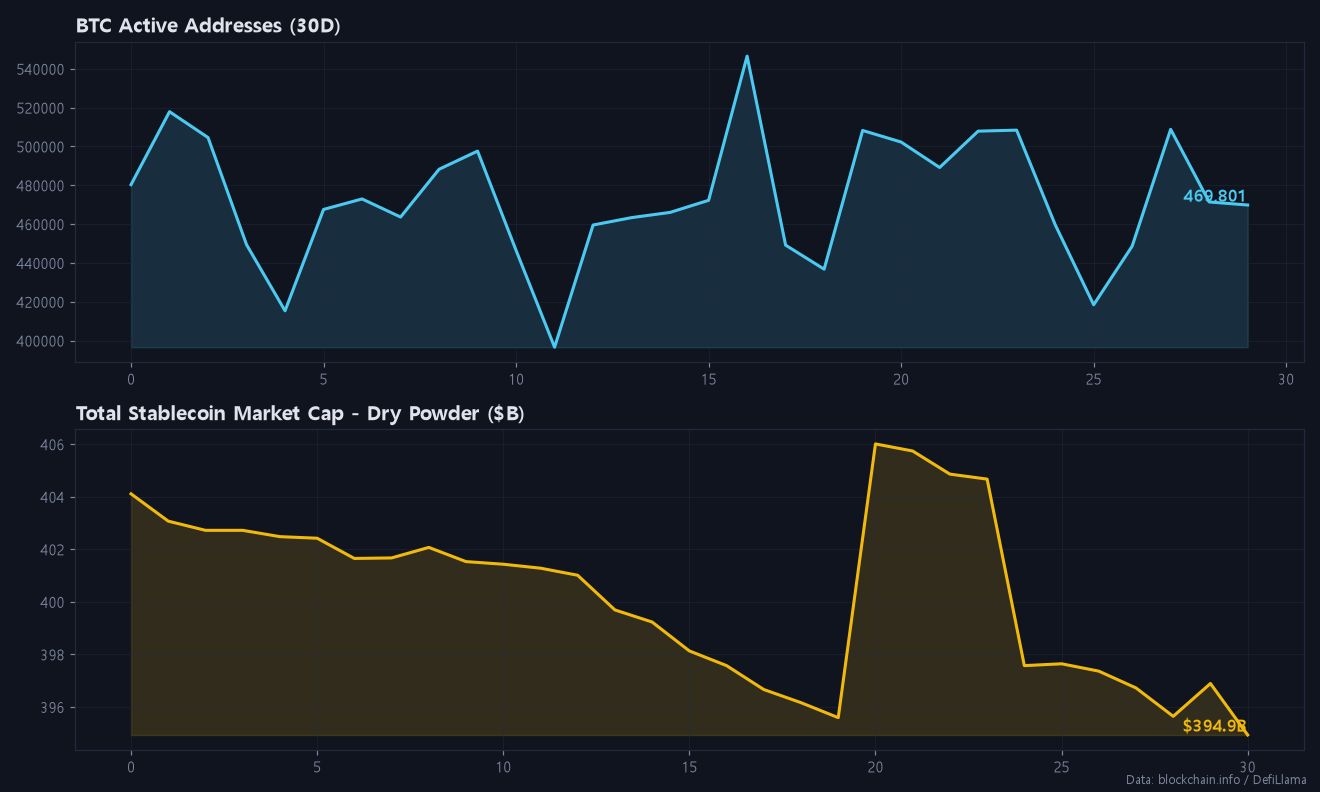
Today’s dataset has no fresh readings for active addresses, stablecoin supply or hashrate, so I won’t guess at them. Flow proxies are available, and they lean bearish:
- OBV: The 24h trend is down, with a net delta of -113,123 BTC. This indicates distribution.
- MFI(14): 46.5, which is neutral. Money is not flooding back in on the bounce.
- VWAP(24h): $69,216.3. Price is 0.92% below it, so sellers control the session average.

- Funding rate: +0.0081%. Funding is still positive after a multi-thousand-dollar drop, so longs are paying to hold.
- Long/short ratio: 3.09, with 75.5% of accounts long. The crowd is heavily long into a downtrend, which leaves room for more long liquidations below $67K.
- Fear & Greed: 20 (Extreme Fear), down from 28. Sentiment is washed out, but positioning is not. That mismatch tends to resolve lower before a durable bottom forms.
- Korea premium: 2.1% (BTC at 93.62M KRW). Local demand is holding. The 90M KRW level is psychological support, with resistance at 95M KRW.
Today’s Position Strategy
SHORT Setup (Primary)
| Item | Level |
|---|---|
| Entry zone | $69,600 – $70,400 (Kijun to Keltner upper / broken 70K), add near $72,000 |
| Target 1 | $67,450 (48h / 7d swing low) |
| Target 2 | $65,000 (key support) |
| Target 3 | $60,000 (only on confirmed 65K breakdown) |
| Invalidation | $72,500 (above MA60 and the 72K resistance) |
Price is below all MAs and below the Ichimoku cloud (cloud bottom $69,346.1). The Tenkan at $69,130.8 is below the Kijun at $69,561.6, and ADX at 38 confirms a strong trend. Funding is still positive and 75.5% of accounts are long, so the liquidation fuel sits below price. The 70K–72K retest zone combines the Kijun, the Keltner upper band and the old support, which makes it the area with the best risk/reward. A rising 10-year yield and a stronger dollar add macro headwind.
LONG Setup (Secondary, counter-trend)
| Item | Level |
|---|---|
| Entry zone | $65,000 – $65,500 (key support flush) |
| Target 1 | $67,450 |
| Target 2 | $68,970 – $69,350 (MA20 / Keltner mid) |
| Invalidation | $63,980 (2x ATR below 65K) |
Extreme Fear at 20 and a Stochastic heading toward oversold can produce sharp technical bounces from major support. This trade is only for a reaction at $65K, ideally with a Stochastic bullish cross under 20 and Williams %R hooking up from below -80. Keep size small and take profit quickly. The crowded long positioning means this is a scalp against the trend, not a bottom call.
This is market analysis, not financial advice, so manage your own risk and size. Fee-payback sign-up links for BingX and Bitunix are at the end of this post if you want to cut trading costs.
Conclusion: Bias stays short below $70K. Sell the $69.6K–70.4K retest with a stop above $72.5K, and treat a $65K bounce only as a tactical scalp.
If you found today’s post helpful, please subscribe and like.
Real-time briefings and new-post alerts on Telegram: t.me/corecryptoinsights · Follow on X: @core_trading1
If you’ve been trading without a fee payback, you’ve been losing money this whole time — start getting your trading fees back today.
▶ BingX 45% fee payback — full sign-up guide
▶ Bitunix 70% fee payback — full sign-up guide
▶ BingX vs Bitunix — which saves you more?
Leave a Reply