BTC is trading at $71,623 on the 4H chart. The 7-day high of $76,302 failed and was followed by a steady slide to a fresh 7-day low of $71,238, so price is still making lower lows. US CPI is ahead, miners are reported to be selling heavily, and macro pressure is building. The question today is whether to short a bounce or wait for a deeper flush before buying.

Indicator Analysis
Moving Averages
Price sits below all major moving averages, and the MA20 is up at $73,833.9, about $2,200 above the current price. That level lines up almost exactly with the $73.8k key resistance, which is also the KRW 100 million equivalent line. Until price gets back above it, every rally runs into overhead supply.
→ The trend structure is bearish, and the MA20 near $73.8k is the line sellers will defend.
RSI (14)
RSI reads 24.3, which is clearly oversold. In a trend this strong, oversold readings can stay pinned for a while rather than trigger an immediate reversal. The reading mainly warns that chasing shorts at current prices offers poor risk-to-reward.
→ Oversold, but not a buy signal on its own. A bounce is more useful as a short entry than as a reason to go long.
MACD
The MACD histogram is at -177.2, below the zero line, with downside momentum holding or strengthening. There is no bullish divergence to work with yet. Sellers still control momentum on this timeframe.
→ Momentum confirms the downtrend. No reversal trigger yet.
Williams %R
Williams %R is at -88.9, deep in the oversold zone and close to the bottom of its range. Price is closing near the lows of the recent lookback window, so buyers have not managed to defend intraday levels.
→ Exhaustion is possible, but a move back above -80 is needed before any bounce becomes credible.
ATR (14)
ATR is $882.9, or 1.23% of price. That gives a practical yardstick for stop placement: roughly 1 to 1.5 ATR beyond structure keeps stops outside normal 4H noise. Bollinger Band width of 5.28% is expanding, so volatility is rising rather than compressing.
→ Size positions for roughly $900 candles and keep stops at least about 1 ATR beyond key levels.
CCI (20)
CCI is at -221.9, an extreme reading well beyond the -100 threshold. Readings like this often show up during capitulation-style legs. Combined with an ADX of 44.8 (strong trend), it points to a trend in full stride, not one that has already reversed.
→ The stretch is extreme, so expect a relief bounce at some point. The bias stays down while ADX stays elevated.
Stochastic
Stochastic %K is 11.1 and %D is 9.3, both deep in oversold territory. %K has edged above %D, which is the earliest hint of a short-term upturn. This is the indicator most likely to flag a relief rally first.
→ A small bullish cross in oversold territory. Watch for a bounce into resistance, not a trend change.
Keltner Channel
The Keltner lower band is $71,990.1, mid at $73,664.3 and upper at $75,338.5. Price is hugging the lower band and has slipped just under it, which matches Bollinger: price is also slightly below the $71,883 lower Bollinger band. Band riding like this is typical of strong trends. Mean reversion toward the mid-band ($73.6k–73.8k) is the natural bounce target.
→ The Keltner mid near $73.7k is the upper limit for any bounce. That is where shorts get interesting.

On-Chain & Positioning
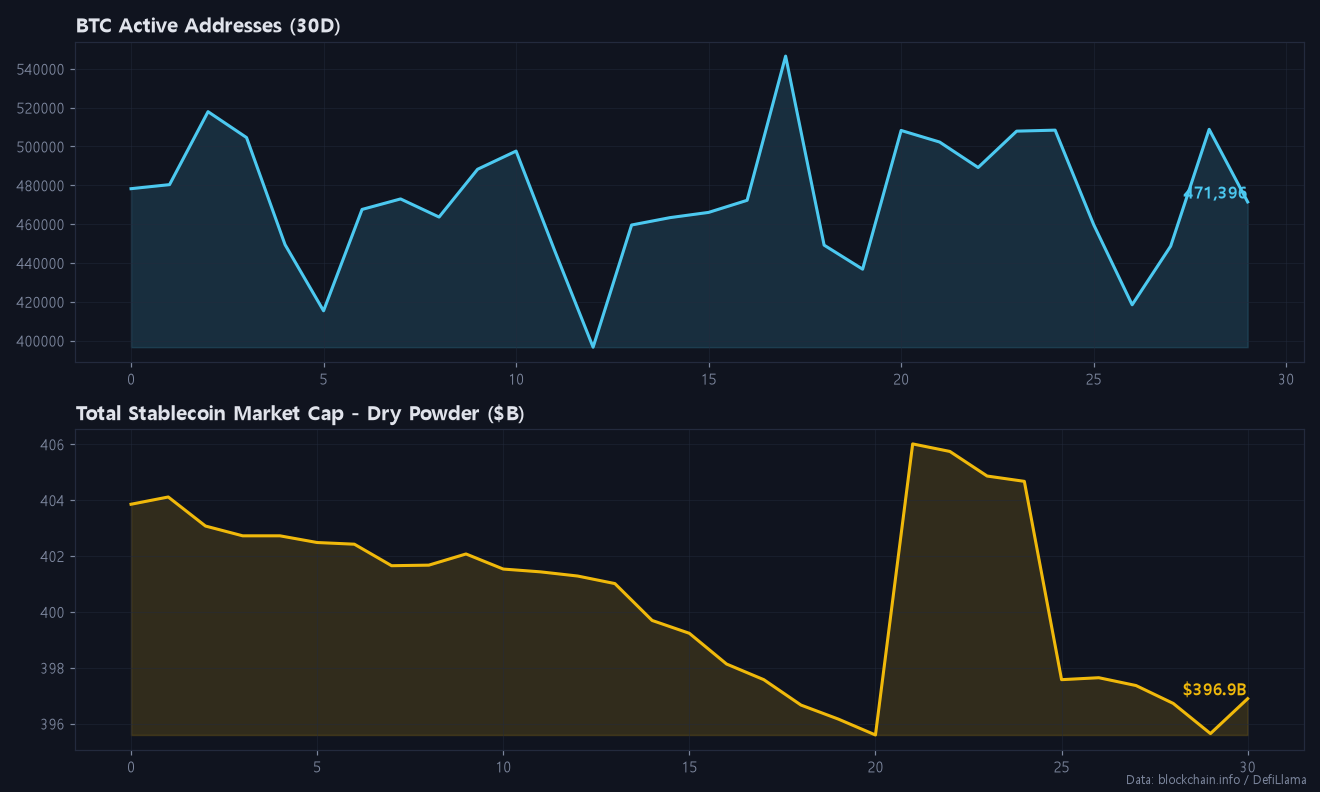
Active address and hashrate figures are not part of today’s dataset, so this section sticks to what is measured. Stablecoin supply is declining, which means less dry powder is waiting on the sidelines to absorb sell pressure. Headlines about large miner selling add to supply on the spot side.

- Funding rate: 0.01%. This is neutral to slightly positive. Longs are still paying, even as price falls.
- Long/Short ratio: 3.16, with 76% of accounts long. This is a crowded long book during a downtrend, and the liquidation fuel sits below price.
- Open interest: +3.48% over 24h. OI is rising while price drops, which points to new positions being opened, many of them likely dip-buying longs. That increases the risk of a liquidation cascade toward $68.5k.
- Fear & Greed: 28 (Fear), down from 29. Sentiment is fearful, but positioning is not. Retail accounts are still heavily long.
On the macro side, the US 10-year yield sits at 5.1%, the Dollar Index rose 0.26% to 103.18, the S&P 500 fell 0.35% and the Nasdaq fell 0.39%. Gold dropped 3.06%, which points to broad de-risking rather than a rotation into hard assets. The Korean premium is 1.39%, a mild level that shows no sign of local panic buying.
Today’s Position Strategy
SHORT Setup (Primary)
| Item | Level |
|---|---|
| Entry zone | $72,500 – $73,000 (bounce into short-term resistance) |
| Target 1 | $71,238 (7-day low) |
| Target 2 | $70,000 (first support) |
| Target 3 | $68,500 (expected long-liquidation cluster) |
| Invalidation (stop) | $74,050 (4H close above the MA20 and the $73.8k key resistance) |
The short side has the trend, momentum and positioning behind it. ADX is 44.8, MACD is below zero and strengthening, and 76% of accounts are long while OI climbs. Shorting at $71.6k, right after an extreme CCI reading, is a poor trade. Waiting for the Stochastic bounce to carry price about 1 ATR higher into $72.5k–73k gives a stop roughly 1.5 ATR away and a reward-to-risk near 2:1 to $70k.
LONG Setup (Secondary)
| Item | Level |
|---|---|
| Entry zone | $68,500 – $69,000 (only after OI drops sharply and funding turns negative) |
| Target 1 | $70,000 |
| Target 2 | $71,238 – $72,500 |
| Invalidation (stop) | $67,600 (about 1 ATR below the liquidation cluster) |
A long only makes sense once the crowded long book has been flushed. That means OI falling hard and funding flipping negative around the $68.5k liquidation zone. Without both conditions, buying oversold readings means trading against the trend. If $67.6k breaks, the next reference is the $66k second support, and longs should stay out.
For ETH, the same logic applies: $1,950 is support and $2,150 is resistance. Treat rallies toward $2,150 as potential short zones while BTC stays below $73.8k.
This is market analysis, not financial advice. Size positions so a single stop-out does not change your month. If you trade these setups on BingX or Bitunix, the fee-payback signup links are at the end of this post.
Conclusion: the bias is short. Sell bounces into $72.5k–73k with a stop above $74k, and consider longs only after a $68.5k flush with negative funding.
If you found today’s post helpful, please subscribe and like.
Real-time briefings and new-post alerts on Telegram: t.me/corecryptoinsights · Follow on X: @core_trading1
If you’ve been trading without a fee payback, you’ve been losing money this whole time — start getting your trading fees back today.
▶ BingX 45% fee payback — full sign-up guide
▶ Bitunix 70% fee payback — full sign-up guide
▶ BingX vs Bitunix — which saves you more?
Leave a Reply