Bitcoin could revisit the $72K-70K zone if support at $72.8K gives way. At $75,648, BTC sits between two pressures. Hashrate is near a record 988 EH/s while fees have collapsed to 1 sat/vB, squeezing miners. Meanwhile, 75.3% of futures accounts are long. That makes $70K the market’s pain line.

The Finland heat-miners and the $70K line
One of the more telling stories in mining right now comes from Finland. Operators there route waste heat from their rigs into district heating networks, selling warmth to towns as a second revenue stream. It is clever engineering. But the economics only work while Bitcoin trades above roughly $70K. Below that, even a miner paid twice for the same electricity starts to struggle.
That is why the anecdote matters. When a business model built to squeeze every last cent out of a kilowatt-hour has a hard floor, that floor tells you where the weakest operators begin to bleed. Today, Bitcoin is about 7% above it. Fear and Greed reads 28 (Fear), up only slightly from 25.
Why are Bitcoin miners under pressure right now?
Miner revenue comes from two places: the block subsidy and transaction fees. Both are measured against the competition for blocks. Right now, every part of that equation is moving the wrong way for miners.
- Hashrate: 988.3 EH/s, up 2.6% over 30 days. More machines are competing for the same fixed issuance, so each unit of hashpower earns less.
- Fees: 1 sat/vB for fast confirmation. That is effectively the floor. The fee cushion that often rescues miners during price dips is gone.
- Transaction count: 591,830 today, down 12.4% against the 30-day average. Fewer transactions mean less fee pressure, and that is unlikely to change soon.
Put those together and hashprice, the revenue per unit of hashpower, is being squeezed from both sides. The numerator (fees plus subsidy value) is flat to falling. The denominator (network hashrate) keeps rising. The only variable that can bail miners out quickly is price.
Miners with thin margins have a predictable playbook when price slips. They sell treasury coins to cover power bills. That selling tends to arrive exactly when the market can least absorb it.
What does Bitcoin futures positioning say?
Now overlay the derivatives picture. The long/short account ratio stands at 3.05, with 75.3% of accounts positioned long. That is a crowded trade by any standard.
What makes it fragile is what is missing. Funding sits at just 0.0044%, close to neutral. Nobody is paying a premium to hold longs. Open interest moved only 0.09% in 24 hours. In plain terms, many small accounts are leaning long, but no fresh capital is arriving to push price higher. A crowded position without new fuel is the setup that tends to unwind sharply.
We have already seen a preview. Roughly $709 million in crypto futures were liquidated in a recent 24-hour stretch, with long liquidations running more than four times shorts. That happened as BTC briefly lost $76K during a tech-stock selloff. Spot Bitcoin ETFs also posted around $400 million in outflows, removing a key source of institutional bid.
The liquidation map matters here. Stops and liquidation levels for late longs tend to cluster just under obvious support. In this case, that means the band between $72.8K and $70K. If price trades into that pocket, forced selling can feed on itself.
What are today’s key BTC support and resistance levels?
| Level | Type | Why it matters |
|---|---|---|
| $78.2K | Resistance | Upper invalidation; short stops sit above $78.5K |
| $76K | Resistance | Lost during the tech selloff; first reclaim test |
| $75,648 | Spot | ▲0.09% in 24h, ▼2.63% over 7 days |
| $74.5K | Support | First short-term shelf |
| $72.8K | Support | Break triggers the long-liquidation zone |
| $70K | Support | Miner breakeven and psychological line |
As the chart shows, Bitcoin has been making lower highs since failing near the upper resistance band. Each bounce stalls before $78K, and the 7-day loss of 2.63% shows a slow grind rather than a capitulation.

On-chain check: is demand thinning?
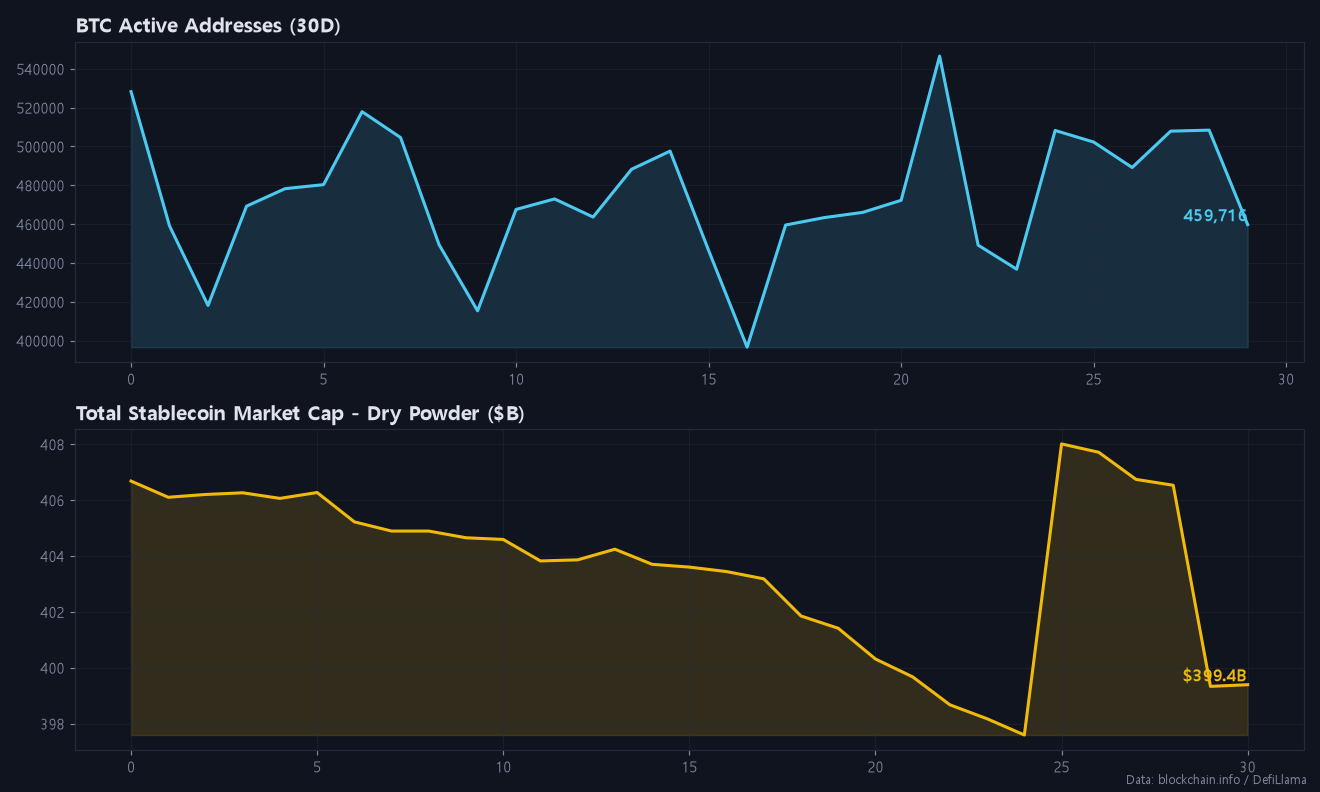
The on-chain data supports the idea that marginal demand is soft rather than collapsing. Active addresses came in at 459,716 today. That is below the 7-day average of 487,466 and 3.0% under the 30-day average. Activity has been choppy, ranging between roughly 397K and 547K over the month, with no clear expansion trend.
Stablecoins are the market’s dry powder, and here the picture is mixed. Total stablecoin market cap stands at $399.4 billion. It is up $1.22 billion over the past week but down $7.29 billion across 30 days. The series slid from about $406.7 billion toward $398 billion before a brief spike and pullback. Capital is not fleeing crypto, but it is not flooding in to buy dips either.
Meanwhile, the network itself has never been stronger. Hashrate near 988 EH/s reflects record security, even as the revenue backing that security thins. The chart below lays out the divergence between rising hashrate and fading activity.
The double trigger scenario vs. the invalidation case
Bearish: miner selling meets long liquidations
The stress test scenario runs like this. Bitcoin loses $74.5K and then $72.8K. Leveraged longs start getting stopped out. That pushes price toward $70K, where higher-cost miners, the Finland-style operations included, face negative margins. Treasury selling then adds spot supply at the same moment derivatives are forcing liquidations. Two independent sellers hitting the same zone is how a dip turns into a flush.
Bullish: reclaiming $76K-78K
The invalidation is clean. A daily close back above $76K, followed by acceptance above $78.2K, would show that buyers can absorb supply. It would also force crowded shorts on lower timeframes to cover. For that to stick, open interest needs to rise alongside price and funding needs to stay moderate. That combination would signal real demand rather than another thin bounce.

Macro and institutional backdrop
The dollar is not helping. The DXY firmed to 102.3 (+0.74%), and the US 10-year yield sits at 4.86%. Higher real yields and a stronger dollar typically drain liquidity from risk assets, and Bitcoin has been trading like one. Equities were mixed but positive: the S&P 500 gained 0.31% and the Nasdaq rose 1.09%. Gold slipped 0.94% to $4,074.9. Even with stocks bouncing, crypto failed to follow, which says something about how thin spot demand is.
On the institutional side, Google launched an MPC-based crypto custody service. That is a meaningful signal. A cloud giant is building infrastructure for digital assets, even if the business is small relative to its cloud revenue. But infrastructure is a long-term story. It does not create buyers this week. The gap between what is being built and what is being bought is the defining feature of this market. BTC dominance at 60.04% reinforces it: capital is consolidating, not rotating into speculation.
Trading playbook: levels, entries and stops
The bias here is neutral to slightly short. Here is how that translates into scenarios:
- Fade the bounce: Scale into shorts across $76K-78K, with a stop above $78.5K. Targets are $74.5K, then $72.8K.
- Breakdown short: A decisive loss of $72.8K opens a trend short aimed at the liquidation pocket toward $70K. Stop back above $74.5K.
- Contrarian long: Only if funding turns negative and the long account share drops below 70%. That shift would mean the crowd has capitulated. A long near $70K-71K with a stop below $68.5K would then have a better risk/reward.
Frequent scaling in and out adds up in fees, so execution costs matter more than most traders admit. Fee-payback signup links are listed at the end of this post. For a breakdown of rebate structures, see this guide to the BingX 45% fee payback referral code or the walkthrough of the Bitunix 70% fee payback sign-up process.
My take
I think $70K gets tested before $80K does. Three-to-one long positioning with no funding premium and flat open interest is not conviction. It is hope. The miners’ situation adds a structural seller that did not exist when fees were healthy. I would rather sell strength into $76K-78K than buy the dip at $74K. I will flip that view quickly if funding goes negative while longs thin out.
Risk warning: Crowded trades can unwind in either direction. A sudden ETF inflow day or a sharp drop in the dollar could squeeze shorts through $78.2K quickly. Use defined stops, keep leverage modest, and never risk capital you cannot afford to lose.
FAQ
Is Bitcoin going to fall to $70K?
It is a realistic risk. If $72.8K breaks, long liquidations and miner selling could push BTC from $75,648 toward the $70K miner-breakeven line.
Why are Bitcoin fees so low right now?
Transaction count is down 12.4% versus its 30-day average, so there is little competition for block space. That has pushed fast fees down to 1 sat/vB.
What would turn Bitcoin bullish again?
A reclaim of $76K followed by acceptance above $78.2K, backed by rising open interest, would invalidate the bearish setup. A drop in the 75.3% long-account share would also help.
If you found today’s post helpful, please subscribe and like.
Real-time briefings and new-post alerts on Telegram: t.me/corecryptoinsights · Follow on X: @core_trading1
If you’ve been trading without a fee payback, you’ve been losing money this whole time — start getting your trading fees back today.
▶ BingX 45% fee payback — full sign-up guide
▶ Bitunix 70% fee payback — full sign-up guide
▶ BingX vs Bitunix — which saves you more?
Leave a Reply