BTC is trading at $64,908 on the 1H chart after a weekend flush to $61,956 that pushed price below $70K for the first time in three months. The bounce has stalled right on the 20-period average, and the 48-hour range of $61,956 to $68,466 now frames the battle.

The mood is grim. Headlines describe a “fourth capitulation phase,” and Bitwise’s CIO compares the market to mid-2018. Price is at least holding above the 24h VWAP of $64,280, about 0.98% under spot. Below are the indicator readings, current positioning and both trade setups for today.
Indicator Analysis
Moving Averages
Price sits just above the MA20 at $64,903, but the larger averages are stacked bearishly: MA60 at $66,362 and MA120 at $69,512. That inverse alignment means every rally into the $66K-$69.5K band runs into sellers who bought higher. Holding the MA20 is a short-term positive only.
→ Trend structure stays bearish while price remains below the MA60 at $66,362.
RSI
RSI(14) reads 62.6, well recovered from the oversold weekend lows and leaning bullish on the short timeframe. It is not stretched, so there is room for a push higher before the overbought zone. In a downtrend, though, readings in the 60s often mark where bounces run out of steam.
→ Momentum supports a bounce, but it is approaching the area where bearish trends usually reject.
MACD
The histogram is positive at 101.3, which reflects the recent recovery. However, the MACD line is still below the zero line, and the momentum read flags the broader bearish momentum as intact. This is a relief move inside a downtrend, not a confirmed reversal.
→ No bullish regime change until MACD reclaims zero.
Williams %R
Williams %R at -52.8 sits almost exactly in the middle of its range. It is neither overbought nor oversold, so it offers no edge in either direction. Price is mid-range relative to its recent highs and lows.
→ Neutral. Wait for price to reach the range edges.
ATR
ATR(14) is $595.8, or 0.92% of price. That is moderate given the volatility of the past week, and it lines up with the Bollinger squeeze (width 2.39%). Stops tighter than about one ATR are likely to get clipped by normal noise.
→ Size positions for roughly $600 hourly swings and expect a volatility expansion out of the squeeze.
CCI
CCI(20) at 18.8 is barely positive and well inside the ±100 band. Price is only slightly above its statistical mean, with no trending impulse. Combined with an ADX of 13.8, the tape is clearly rotational.
→ Range conditions. Fade the extremes rather than chase the middle.
Stochastic
Stochastic %K at 47.2 has slipped under %D at 51.7. That is a mild bearish crossover in the middle zone. It suggests the latest push higher is losing short-term drive.
→ Slight downside tilt in the very short term.
Keltner Channel
The Keltner mid sits at $64,975.6, with the upper band at $66,020.7 and the lower band at $63,930.4. Price is just under the midline, consistent with a market that cannot hold the center. The bands also cluster close to key levels: the upper band near the MA60, and the lower band near the $63K first support.
→ $66K to $63.9K is today’s working range. The edges are where trades get built.

On-Chain & Positioning
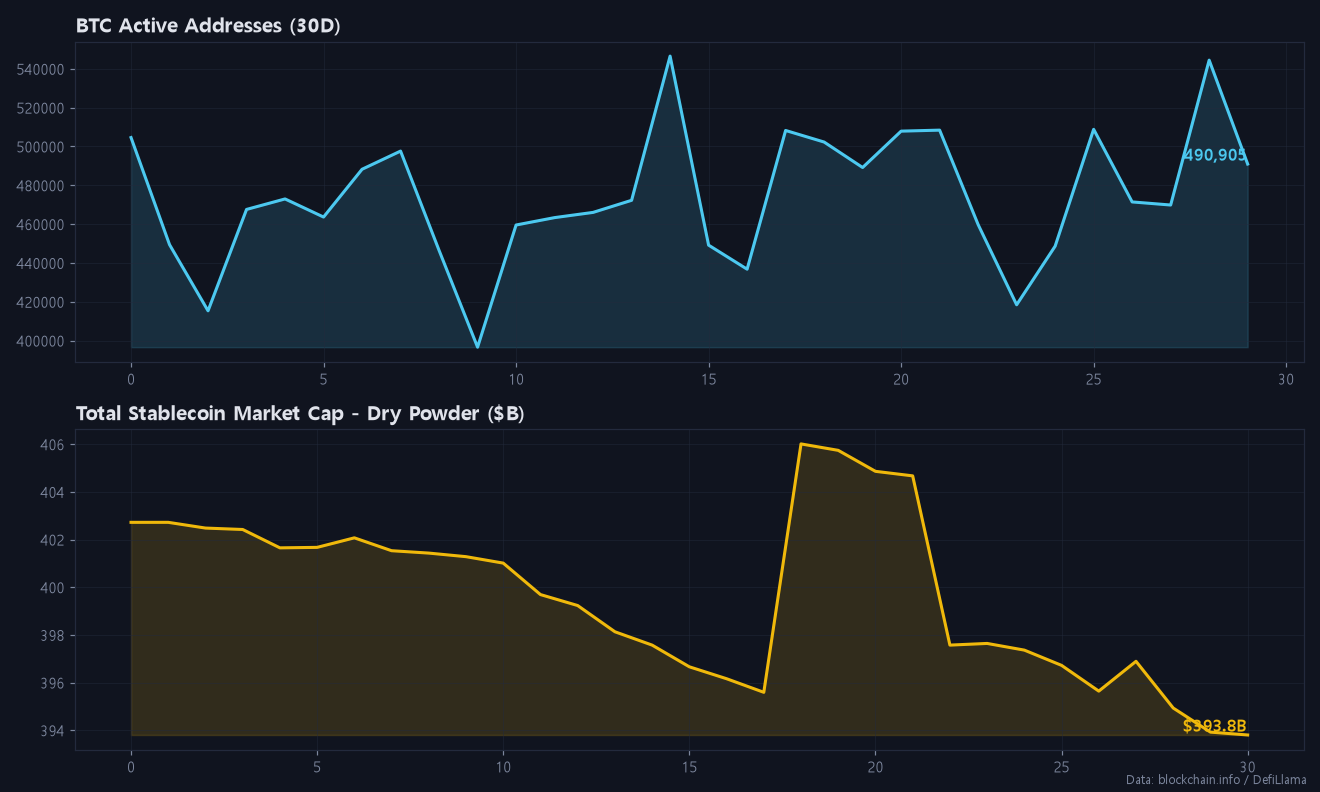
Today’s data feed carries no updated figures for active addresses, stablecoin dry powder or hashrate, so no numbers are quoted for them here. The chart below shows the latest on-chain picture for reference.

- Funding rate: -0.0001%, slightly negative. Shorts are now paying a marginal premium, which shows short interest building among larger accounts.
- Long/short ratio: 2.97, with 74.8% of accounts long. Retail is still heavily crowded on the long side despite the selloff, which leaves fuel for further liquidations.
- Open interest: -4.18% over 24h. Deleveraging is underway, but the account skew shows the cleanup is incomplete.
- Fear & Greed: 10 (Extreme Fear), down from 13. Sentiment this washed out can produce sharp squeezes, but it is not a timing signal on its own.
On-balance volume has fallen over 24h, with a delta of -53,029 BTC, which points to distribution. MFI is 62.8. The Korean premium is 3.24%, so local demand remains firm.
The macro backdrop does not help. The Nasdaq fell 0.91%, the S&P 500 dropped 0.4%, the dollar index gained 0.23% to 103.41, and the US 10-year yield is at 5.15%. Ichimoku shows price inside the cloud ($64,516-$65,527), with the Tenkan above the Kijun. That reads as sideways with a short-term edge to buyers, but no breakout.
Today’s Position Strategy
SHORT Setup (Primary)
| Item | Level |
|---|---|
| Entry zone | $66,300 – $67,500 |
| Target 1 | $64,900 (MA20 / Bollinger mid) |
| Target 2 | $63,900 (Keltner lower) |
| Target 3 | $63,000 (first support) |
| Invalidation (stop) | $68,550 (above 48h high $68,466) |
This is the primary side. The moving averages are inverted, MACD remains below zero, OBV shows distribution, and 74.8% of accounts are still long into a deleveraging market. The entry zone stacks the MA60 ($66,362), the Keltner upper band area and the $67.5K resistance. That makes it the logical spot to sell a relief rally. Do not chase shorts below $63K, because negative funding and extreme fear raise the risk of a short squeeze there.
LONG Setup (Secondary)
| Item | Level |
|---|---|
| Entry zone | $63,000 – $63,900 |
| Target 1 | $64,900 (MA20) |
| Target 2 | $66,000 (Keltner upper) |
| Invalidation (stop) | $61,700 (below weekend low $61,956) |
This is a counter-trend range trade only. The Keltner lower band, the $63K first support and the weekend low just below create a defined risk area. Fear & Greed at 10 and slightly negative funding could trigger a squeeze if sellers fail there. Keep size smaller than on the short, and take profit quickly at the MA20, since the higher-timeframe trend is still down.
As always, this is market analysis, not financial advice. Manage your own risk and leverage accordingly. Fee-payback signup links for BingX and Bitunix are at the end of this post if you want to lower your trading costs.
Bias: sell rallies into $66.3K-$67.5K, buy only a defended $63K, and step aside in the middle of the squeeze.
If you found today’s post helpful, please subscribe and like.
Real-time briefings and new-post alerts on Telegram: t.me/corecryptoinsights · Follow on X: @core_trading1
If you’ve been trading without a fee payback, you’ve been losing money this whole time — start getting your trading fees back today.
▶ BingX 45% fee payback — full sign-up guide
▶ Bitunix 70% fee payback — full sign-up guide
▶ BingX vs Bitunix — which saves you more?
Leave a Reply