Bitcoin looks closer to a 2018-style grind than a crash. BTC trades near $64,943 after slipping below $63K, the Fear & Greed Index sits at 10, and dominance is 59.38%. The sentiment rhymes with mid-2018, but spot ETFs, corporate treasuries and a 5.15% 10-year yield make this cycle structurally different.

Bitwise’s chief investment officer put a historical frame on the selloff, saying the market “feels like mid-2018” and warning that crypto could spend a stretch “wandering in the wilderness.” That is an uncomfortable comparison for anyone who remembers 2018, when Bitcoin bled for most of a year and altcoins lost far more. But analogies are only useful if we test them. This piece looks at where the 2018 comparison holds, where it breaks, and what would prove the long-winter thesis wrong.
Why does the Bitcoin market feel like mid-2018?
Start with the tape. Bitcoin is down 14.16% over seven days and recovered only 0.67% in the last 24 hours after a weekend flush that briefly took it below $63,000. One widely cited desk described it as a “fourth capitulation phase,” and roughly $1 billion in long positions was wiped out during the broader 6% market drop.
Sentiment is the clearest parallel. The Fear & Greed Index printed 10 (Extreme Fear), down from 13 the day before. Readings this low were common through 2018, when every bounce was sold and the narrative shifted from “when moon” to “is crypto dead.”
The altcoin pattern also matches. In 2018, alts fell much harder than BTC as speculative capital fled to the relative safety of the largest asset. The same rotation is happening now:
| Asset | Price | 24h | 7d |
|---|---|---|---|
| BTC | $64,943 | ▲ 0.67% | ▼ 14.16% |
| ETH | $1,817.81 | ▲ 2.46% | ▼ 18.16% |
| SOL | $71.72 | ▲ 2.36% | ▼ 19.71% |
| XRP | $0.9598 | ▲ 4.65% | ▼ 16.54% |
| BNB | $592.79 | ▲ 2.50% | ▼ 14.69% |
Every major alt underperformed Bitcoin on the week, and BTC dominance sits at 59.38%. In 2018, dominance climbed steadily as alts collapsed, and the current reading points to the same flight to quality.

Where the 2018 analogy breaks down
The analogy fails on market structure. In 2018 there were no spot Bitcoin ETFs, no public companies holding BTC as a treasury reserve asset, and no regulated wrappers for pensions or advisers. Bitcoin’s holder base was mostly retail and early adopters, with very little sticky institutional supply.
That has changed, but the change cuts both ways. ETF holders and corporate treasuries add a steady bid in normal conditions. They can also sell together when redemptions or balance-sheet stress hit. Some of the recent pressure has been tied to concerns around digital-asset treasury companies, a risk that did not exist in 2018.
Macro is the other big difference. In 2018, the US 10-year yield traded around 3%. Today it sits at 5.15% and rose another 1.0% on the day. The dollar index is firming at 103.41 (+0.23%), the Nasdaq fell 0.91% to 25,136, and the S&P 500 slipped 0.4%. Gold is flat near $3,886. A 2018-style winter was largely a crypto-specific hangover from the ICO bubble. Today’s winter would be driven by tight financial conditions that weigh on every long-duration risk asset. That makes it harder to escape through crypto-native catalysts alone.
Builders don’t care about price: the infrastructure thread
The most useful part of the 2018 comparison has little to do with price. While BTC fell from five figures to the low thousands, the industry built the rails for the next cycle: dollar stablecoins scaled, DeFi primitives like lending markets and automated market makers were launched, and institutional custody took shape. None of that showed up in prices until 2020.
The same pattern is visible in today’s headlines, this time at the sovereign level.
- Kazakhstan plans to issue tokenized government bonds in the first quarter, following a $22 million note sale. A national treasury putting sovereign debt on-chain during a bear market is a strong signal that tokenization has moved beyond pilots.
- The Bank of England, the Monetary Authority of Singapore and the Bank of Thailand are testing cross-border FX settlement as stablecoins gain ground. Central banks are building settlement infrastructure partly because private stablecoins are forcing the issue.
Neither headline moves Bitcoin’s price this week. Both suggest that the institutional plumbing keeps getting built regardless of the Fear & Greed reading. That is exactly what happened in 2018.
What is on-chain data saying about Bitcoin right now?
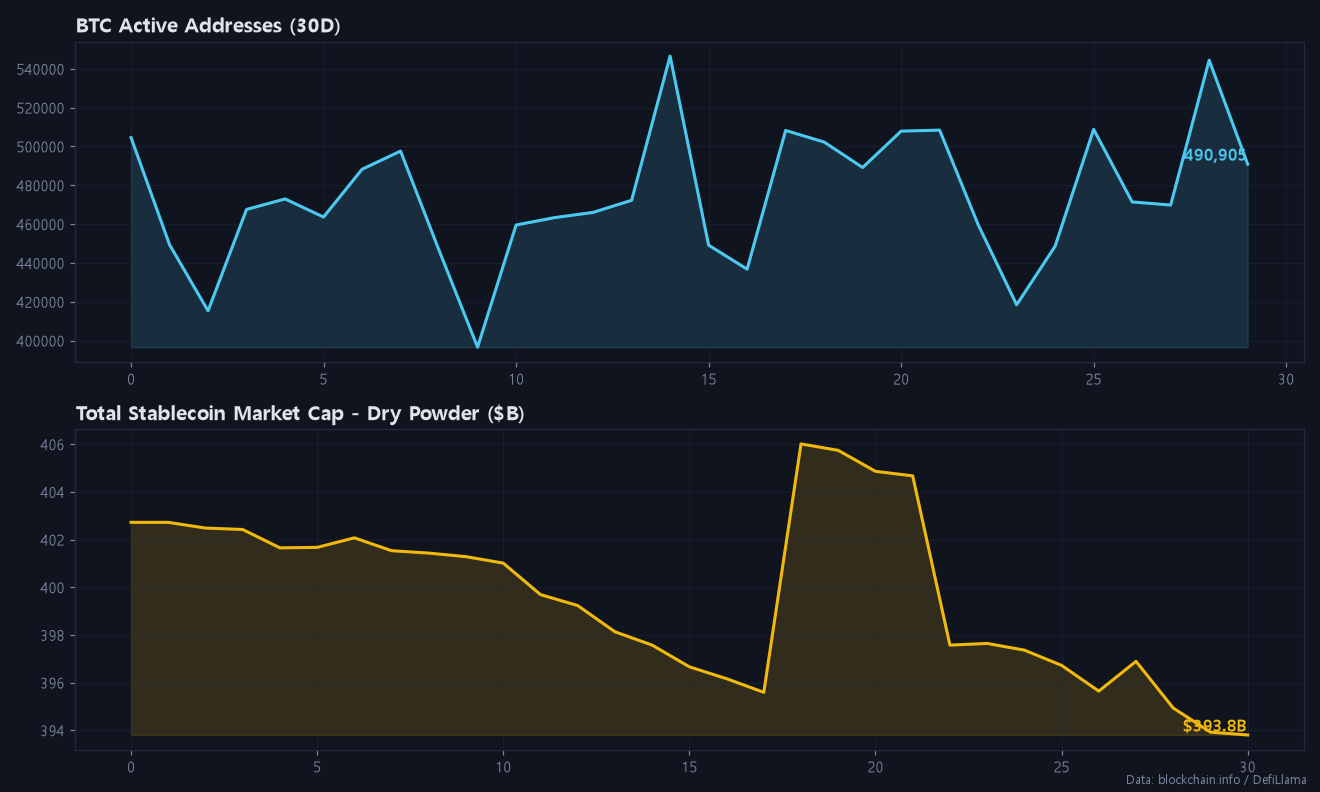
On-chain activity is mixed. Bitcoin active addresses came in at 490,905, above the seven-day average of 478,907 and 3.5% above the 30-day average. Users have not left the network. Transaction count, however, is 23.6% below its 30-day average at 465,786, and fast mempool fees are just 2 sat/vB. That is a quiet network, not a busy one.
Stablecoin supply matters more for the long-winter thesis. Total stablecoin market cap is $393.8 billion, down $3.84 billion over seven days and $8.93 billion over 30 days. In a healthy market, stablecoin supply is dry powder waiting to be deployed. A shrinking supply means capital is leaving the ecosystem rather than sitting on the sidelines. Hashrate is 923.6 EH/s, down 7.4% over 30 days, which hints at margin pressure on miners at these prices.
The chart above shows the pattern: steady participation, but a gently declining stablecoin base. That is consistent with a slow bleed rather than a sharp V-shaped recovery.
The DeFi blue-chip bounce: an early tell?
The most interesting move of the day came from a specific corner of the market. Revenue-generating DeFi protocols led the rebound: AAVE +9.94% to $108.47, UNI +9.29% to $5.15, HYPE +9.29% to $67.67, and JUP +10.51%. ZEC (+10.3%) and VVV (+18.03%) also ran, but the DeFi cluster stands out.
One green day does not make a trend. Still, the rotation fits the infrastructure thesis. If tokenized bonds and stablecoin settlement grow, lending markets, exchanges and derivatives venues with real fee revenue are the most direct beneficiaries. In 2018, the projects that survived and later led were the ones generating real usage. Capital appears to be making that distinction early this time.
What are today’s key BTC support and resistance levels?
Derivatives positioning argues for caution. Open interest fell 4.18% in 24 hours, so deleveraging is underway. Yet 74.8% of accounts are still long, a long/short ratio of 2.97, which means retail longs remain crowded. Funding has flipped slightly negative to -0.0001%, so larger players are building shorts. Add a weak Nasdaq and a firm dollar, and rallies are likely to meet supply.
- Support: $63,000 first, then $62,000 (weekend low)
- Resistance: $67,500, then $70,000, the level lost three months ago
- XRP: support $0.90, psychological resistance $1.00, second resistance $1.05
Short scenario (preferred): Fade a bounce into $67,000–68,000, with a stop above $70,500 and targets at $63,000, then $62,000. Avoid chasing shorts below $63,000. With funding negative and shorts building, that zone carries real squeeze risk.
Long scenario (lower conviction): Buy a reclaim of $63,000 after a wick into $62,000, with a stop below $61,200 and targets at $65,500, then $67,500.
In a choppy range, trading costs add up quickly. Fee-payback sign-up links are at the end of this post. For details, see this BingX referral guide for 45% fee payback and the Bitunix sign-up guide with 70% fee payback.
My take: the analogy is right about mood, wrong about duration
I think Bitwise is right about the psychology and probably too pessimistic about the timeline. The 2018 winter lasted because there was no new buyer class. Today there is one, but it is waiting on macro. A 5.15% 10-year yield is the real ceiling on crypto, not a lack of builders. I lean neutral to slightly bearish on Bitcoin over the next few weeks. Over a 6–12 month horizon, I would be building exposure gradually in revenue-generating infrastructure plays rather than waiting for a perfect bottom.
Risk warning: Extreme Fear readings can stay extreme for months, and 2018 showed that “cheap” can get much cheaper. Leverage in a market with crowded retail longs and rising yields is the fastest way to get liquidated. Size positions small and always use stops.
What would invalidate the long-winter scenario?
- A daily close back above $70,000: that would reclaim the breakdown level and trap late shorts.
- Stablecoin supply re-expanding: a reversal of the $8.93 billion 30-day decline would show fresh capital entering.
- A macro relief rally: falling yields, a softer dollar and a Nasdaq rebound would remove the main headwind that makes this cycle different from 2018.
If two of those three line up, the wilderness may be shorter than the Bitwise analogy suggests.
FAQ
Is Bitcoin in a bear market right now?
Bitcoin is down 14.16% on the week to about $64,943, and the Fear & Greed Index reads 10. Sentiment and price action look like a bear phase, though $63,000 support is still holding.
Why are altcoins falling more than Bitcoin?
Capital is consolidating into BTC, which pushed dominance to 59.38%. ETH (-18.16%) and SOL (-19.71%) both underperformed on the week, the same pattern seen in 2018.
What price would signal a Bitcoin recovery?
A daily close above $70,000, combined with growing stablecoin supply (currently $393.8 billion), would be the clearest sign that the long-winter scenario is losing credibility.
If you found today’s post helpful, please subscribe and like.
Real-time briefings and new-post alerts on Telegram: t.me/corecryptoinsights · Follow on X: @core_trading1
If you’ve been trading without a fee payback, you’ve been losing money this whole time — start getting your trading fees back today.
▶ BingX 45% fee payback — full sign-up guide
▶ Bitunix 70% fee payback — full sign-up guide
▶ BingX vs Bitunix — which saves you more?
Leave a Reply