BTC is trading at $63,584 on the 1-hour chart, recovering from the 48-hour low of $62,030.8 but still well below the 7-day high of $73,659.4. Headlines point to rate-hike worries, ETF outflows and a broken long-term support near $65K. Today’s bounce looks like a relief move inside a larger downtrend.

Indicator Analysis
Moving Averages
Price sits above the MA20 ($63,124.8) but below the MA60 ($64,078.0) and the MA120 ($64,556.0). The averages are stacked in bearish order, with short below mid below long. The bounce has reclaimed the fast average, but the $64,078–$64,556 band directly overhead is where sellers are likely to show up.
→ Short-term lift inside a bearish MA structure. The MA60/MA120 zone is the key sell area.
RSI (14)
RSI reads 55.9, slightly above the midline. Momentum has recovered from the selloff, but it is nowhere near overbought on this reading. That leaves some room for the bounce to stretch toward resistance before it stalls.
→ Neutral-to-mildly bullish. RSI alone does not confirm a top.
MACD
The histogram is positive at 142.7, and upward momentum is strengthening. However, the MACD is still below the zero line, so this is a recovery within bearish territory rather than a confirmed trend change. A rollover in the histogram below zero would mark the bounce as finished.
→ Bounce momentum is real, but the zero line is still overhead.
Williams %R
Williams %R is at -14.7, inside the overbought zone above -20. Price is pressing the top of its recent range. In a downtrend, readings this high often precede a pullback rather than a breakout.
→ Overbought on the short-term range. Upside chasing is risky here.
ATR
ATR (14) is $538.4, or 0.85% of price. That is a normal hourly swing, not panic volatility. Stops tighter than about one ATR are likely to be clipped by noise, which is why the levels below use 1–1.5 ATR buffers.
→ Size positions for roughly $540 hourly swings and keep stops beyond one ATR.
CCI (20)
CCI is at 85.9, approaching the +100 threshold but not through it. Buying pressure has built steadily during the rebound, yet the reading has not yet reached an extreme.
→ Positive momentum nearing stretched levels. A failure below +100 would favor sellers.
Stochastic
%K is 85.3 and %D is 87.2, both in overbought territory. %K has slipped under %D, an early sign the upswing is losing pace. Combined with Williams %R, the short-term oscillators are flashing caution for longs.
→ Overbought with a bearish %K/%D cross starting. Watch for a drop below 80.
Keltner Channel
Price is above the Keltner midline ($63,337.4), with the upper band at $64,543.3 and the lower band at $62,131.4. The upper band nearly matches the MA120 ($64,556), so the $64.5K area has strong technical overlap. The lower band lines up with the 48-hour low near $62,030.
→ The $64.5K upper band is the short trigger zone, and $62.1K is the downside magnet.
Several other readings fill in the picture:
- ADX: At 43.5, it signals a strong trend, and given the bearish MA stack, that trend is down.
- Ichimoku: Price is inside the cloud ($63,257.6–$63,728.2), with the Tenkan below the Kijun.
- VWAP: Price is 0.58% above the 24h VWAP ($63,215), so intraday buyers hold a small edge.

On-Chain & Positioning
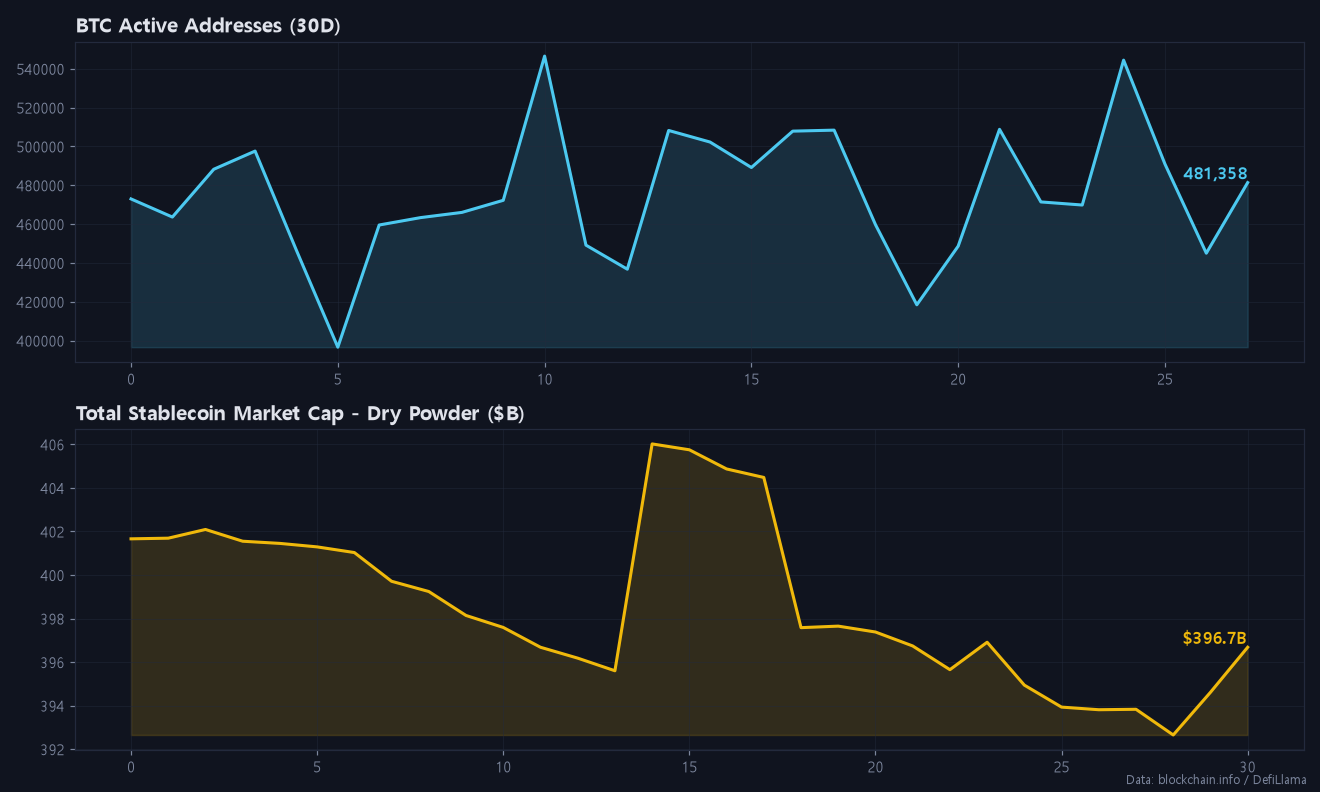
Active address, stablecoin reserve and hashrate figures are not part of today’s verified dataset, so I won’t guess at them. The best flow proxy available is OBV. It has trended lower over 24 hours, with a delta of -80,581 BTC, showing distribution outweighing accumulation even as price bounced.

- Funding rate: At 0.0066%, funding is slightly positive. Longs are paying, but not at an overheated level.
- Long/short ratio: The ratio is 2.97, with 74.8% of accounts long. That is a heavily one-sided crowd.
- Open interest: OI is up 4.74% in 24h while price has fallen. Fresh longs are being added into weakness, and trapped long positions are building up.
- Fear & Greed: The index is at 10 (Extreme Fear), down from 11. Retail sentiment is extremely negative while derivatives traders lean long, an unusual split.
- Kimchi premium: The Korean premium is 1.72%, which means local demand is holding up.
Today’s Position Strategy
SHORT Setup (Primary)
| Item | Level |
|---|---|
| Entry zone | $64,050 – $64,550 (MA60 / Bollinger upper $64,126 / Keltner upper / MA120) |
| Target 1 | $63,125 (MA20 / Bollinger mid) |
| Target 2 | $62,130 (Keltner lower / 48h low area) |
| Target 3 | $60,000 (psychological support, take most profit) |
| Stop | $65,200 (above the $65K broken support, roughly 1.2 ATR over the entry ceiling) |
Rationale: The bearish MA alignment, strong ADX and a MACD still below zero all describe a downtrend that is bouncing, not reversing. Overbought Williams %R and Stochastic put price at the top of its short-term range just as it reaches heavy resistance. With 74.8% of accounts long and OI rising into falling prices, a break below $62K could trigger a chain of long liquidations. Because of Fear & Greed at 10, take most profit near $60K and stay alert to a short squeeze there.
LONG Setup (Secondary, counter-trend)
| Item | Level |
|---|---|
| Entry zone | $62,050 – $62,250 (48h low / Keltner and Bollinger lower bands) |
| Target 1 | $63,125 (MA20) |
| Target 2 | $63,730 (Ichimoku cloud top) |
| Stop | $61,400 (below the 7d low of $61,956 by about one ATR) |
Rationale: Extreme fear readings and the $62K band, where both channel bands meet the 48h low, offer a reasonable spot for a mean-reversion bounce. This trade runs against the dominant trend and a crowded long book, so it calls for smaller size and quick profit-taking. A clean hourly close below $61,956 cancels the idea, and the short becomes the only active play.
Rates add pressure in the background. The US 10-year yield is at 5.07% despite a small daily dip, and the dollar index is steady at 103.8. Equities are mixed, with the S&P 500 down 0.23% and the Nasdaq up 0.42%. Citi’s lowered price target and caution ahead of Anthropic’s IPO and Nvidia earnings keep sentiment fragile. This is market analysis, not financial advice, so size every trade to your own risk tolerance. Fee-payback signup links for BingX and Bitunix are at the end of this post if you want to cut trading costs.
Conclusion: Sell rallies into $64,050–$64,550 with a stop above $65.2K, target $62.1K and then $60K, and treat any $62K long as a quick counter-trend scalp only.
If you found today’s post helpful, please subscribe and like.
Real-time briefings and new-post alerts on Telegram: t.me/corecryptoinsights · Follow on X: @core_trading1
If you’ve been trading without a fee payback, you’ve been losing money this whole time — start getting your trading fees back today.
▶ BingX 45% fee payback — full sign-up guide
▶ Bitunix 70% fee payback — full sign-up guide
▶ BingX vs Bitunix — which saves you more?
Leave a Reply