BTC is trading at $63,981.6 on the 1H chart. Price sits below every major moving average in a bearish stack and is grinding inside the 48-hour range of $63,300.9 to $65,679.2. The 7-day swing from $74,771.4 down to $61,956.3 still defines the larger picture, and sellers have controlled it.

Fee-payback signup links for BingX and Bitunix are at the end of this post.
Indicator Analysis
Moving Averages
The MA20 is at $64,418.8, the MA60 at $64,712.2 and the MA120 at $66,003.0. They are in full bearish order, and price trades below all three. The MA20 and MA60 are only about 300 dollars apart, so the $64.4K to $64.7K band is the first real ceiling on any bounce. ADX at 34.0 confirms this is a strong trend rather than random chop.
→ Trend bias stays bearish while price holds under $64.7K.
RSI
RSI(14) reads 39.7. That is weak but not oversold, which leaves room for another leg down before buyers get a technical excuse to step in. It also means the market is not stretched enough to justify blind dip buying.
→ Bearish momentum with no oversold cushion yet.
MACD
The MACD histogram is at -70.2 and still below the zero line. The histogram is rising, so bearish momentum is fading at the margin. That pattern often comes before a relief bounce, not before a trend change.
→ Expect a bounce attempt, but zero-line structure still favors sellers.
Williams %R
Williams %R sits at -68.0, in the lower half of its range but short of the -80 oversold threshold. Sellers have the upper hand, but the reading is not at an exhaustion point.
→ No exhaustion signal; downside remains open.
ATR
ATR(14) is $583.1, or 0.91% of price. Volatility is moderate for a strong-trend environment. A stop tighter than about one ATR is likely to be clipped by normal hourly noise. Bollinger width of 3.07% and expanding bands support sizing stops with this volatility in mind.
→ Use stops of at least 1 to 1.5 ATR, roughly $600 to $900.
CCI
CCI(20) is -68.6, below zero but not in the sub-100 zone that marks an aggressive selling extreme. This matches the RSI and Williams %R readings: momentum is negative without being capitulative.
→ Bearish but not stretched; rallies are likely to be sold.
Stochastic
Stochastic %K is 32.0 and %D is 27.9. %K has crossed above %D from the lower zone. This is the most constructive short-term signal on the board and fits the rising MACD histogram.
→ Short-term bounce signal; watch whether it carries into $64.4K resistance.
Keltner Channel
The Keltner mid is $64,316.6, the upper band $65,529.4 and the lower band $63,103.7. Price is below the midline. The lower band lines up almost exactly with the 48-hour low near $63,300, which creates a clear support shelf. The upper band, together with the Bollinger upper at $65,406.4, marks where a bounce should run out of air.
→ Range map: $63.1K floor, $64.3K pivot, $65.5K ceiling.

On-Chain & Positioning
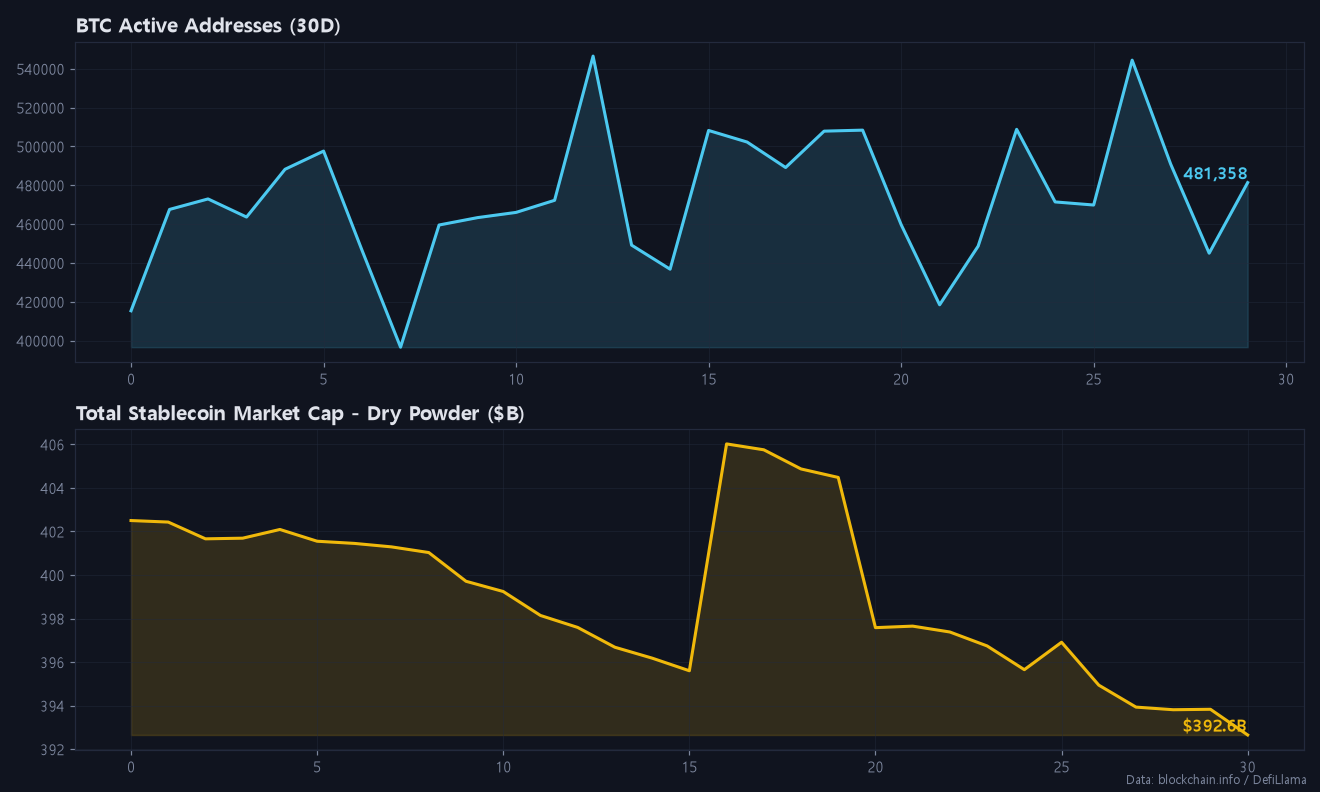
Today’s dataset does not include fresh readings for active addresses, stablecoin reserves or hashrate, so I will not guess at those trends. Volume flow does give a clear signal. OBV over 24 hours is falling, with a delta of -54,447 BTC, which points to distribution. MFI at 36.6 confirms that money is leaving rather than entering. Price is also 0.66% below the 24-hour VWAP of $64,409.1, so intraday sellers hold the average cost advantage.

- Funding rate: 0.003%, essentially neutral. Longs are not paying up heavily to hold positions.
- Long/short ratio: 3.08, with 75.5% of accounts long. Retail is crowded on the long side even into a downtrend, which is fuel for a flush if support breaks.
- Open interest: -0.8% over 24 hours. Leverage is not expanding, so this is not yet an overheated setup.
- Fear & Greed: 12, Extreme Fear, up slightly from 10. Sentiment is washed out, which argues against chasing shorts at the lows.
The combination matters. Heavy long-account positioning without high funding means a break of $62.5K could trigger cascading long liquidations. Extreme Fear, meanwhile, means sharp short squeezes are possible at any time.
The macro backdrop adds pressure. The US 10-year yield sits at 5.1%, the S&P 500 fell 1.03% and the Nasdaq fell 0.74%. Headlines focus on rate anxiety and record downside bets around the $60K level. The Korean premium of 2.07% shows local demand has not fully capitulated.
Today’s Position Strategy
SHORT Setup (Primary)
| Item | Level |
|---|---|
| Entry zone | $65,400 to $65,950 (scale in) |
| Target 1 | $64,400 (VWAP / MA20 / Kijun) |
| Target 2 | $63,300 (48h low) |
| Target 3 | $62,500 (key support) |
| Invalidation | $66,600 (1H close above) |
The entry zone stacks the Bollinger upper band ($65,406.4), the Keltner upper band ($65,529.4) and the 48-hour swing high ($65,679.2). Together they form a dense ceiling below the MA120 at $66,003. The bearish MA stack, ADX at 34 and distribution on OBV make selling into strength the higher-probability trade. The stop sits roughly 1.6 ATR above the swing high, so normal noise should not take it out. If price instead extends to $66K to $67.5K, a second scaled short tranche toward the $67.5K resistance is reasonable, with the stop moved above $68,100.
LONG Setup (Secondary, counter-trend)
| Item | Level |
|---|---|
| Entry zone | $62,500 to $63,100 |
| Target 1 | $64,350 (Keltner mid / VWAP) |
| Target 2 | $65,400 (Bollinger upper) |
| Invalidation | $61,700 (below 7d low) |
This is a reaction trade at the Keltner lower band ($63,103.7) and the $62.5K support. The rising MACD histogram, the stochastic bullish cross and Extreme Fear at 12 all favor a bounce off that shelf. Keep size small, because the trend is against you and crowded longs could turn a support break into a fast liquidation cascade. If $61,956 gives way, the next magnet is the $60K psychological level, and longs should already be out.
Avoid opening fresh shorts at current prices near $64K. The risk/reward is poor with sentiment this depressed and short-term oscillators turning up. Let price come to the levels. This post is market analysis for educational purposes, not financial advice, so size positions according to your own risk tolerance.
Conclusion: Bias is neutral-to-short. Sell bounces into $65.4K to $65.9K with a stop above $66.6K, and treat $62.5K as the line where long liquidations could accelerate the move toward $60K.
If you found today’s post helpful, please subscribe and like.
Real-time briefings and new-post alerts on Telegram: t.me/corecryptoinsights · Follow on X: @core_trading1
If you’ve been trading without a fee payback, you’ve been losing money this whole time — start getting your trading fees back today.
▶ BingX 45% fee payback — full sign-up guide
▶ Bitunix 70% fee payback — full sign-up guide
▶ BingX vs Bitunix — which saves you more?
Leave a Reply