Bitcoin is likely in a bottoming process, but probably not a fast one. At $64,676, BTC trades about 12% below its 200-week moving average near $73.5k, a deviation that has preceded strong 3-month returns before. With the US 10-year yield at 5.1%, a V-shaped recovery looks less likely than a slow, time-based base.

Bitcoin has fallen 12.59% over the past seven days, and the Fear and Greed Index sits at 11 (Extreme Fear). Historically, that kind of capitulation below the 200-week moving average (200WMA) has been one of the more reliable long-horizon buy signals in crypto. This report asks whether this time is different. It weighs the historical signal against a macro and institutional backdrop that looks less supportive than in past cycles.
Where Is Bitcoin Trading Relative to the 200-Week Moving Average?
The 200WMA is widely treated as Bitcoin’s long-cycle cost basis. Price has spent very little time below it. At roughly $73.5k, today’s 200WMA sits about 12% above spot, so BTC is trading in territory that has historically marked generational lows rather than continuation zones.
Shorter-term levels still matter. The crash-week low at $62,000 is first support, with $60k as the psychological floor beneath it. On the upside, $67.5k–68k is the first resistance band. A reclaim of the 200WMA near $73.5k would be the clearest evidence that the trend has turned. As the chart shows, the recent selloff cut through several weekly supports with little pause, and the current consolidation near $64k–65k has yet to produce a higher low.

Is the 200-Week Moving Average Signal Still Bullish?
The table below summarizes the major episodes in which BTC traded materially below its 200WMA. Figures are approximate and rounded, measured from the rough period of deepest deviation, and should be read as directional rather than precise.
| Episode | Approx. deviation below 200WMA | Approx. 3-month forward return | Rate backdrop |
|---|---|---|---|
| Jan 2015 (post-Mt. Gox bear) | Low double digits | Modestly positive | Zero rates, Fed on hold |
| Mar 2020 (COVID crash) | ~30%+ | ▲ roughly +80–100% | Emergency cuts, QE |
| Jun 2022 (Luna/3AC) | ~20%+ | → roughly flat | Aggressive Fed hikes |
| Nov 2022 (FTX collapse) | ~20% | ▲ roughly +35–45% | Hikes slowing, yields peaking |
| Today | ~12% | ? | 10Y near 5.1% |
The pattern is clear. The strongest payoffs came when monetary conditions were easing or about to ease. The June 2022 episode is the useful counterexample. The deviation was deep, but yields kept rising, and BTC chopped sideways for months before the real low arrived in November, once yields began to peak. The signal worked, but it worked on the Fed’s timeline, not the chart’s.
Why Are Bond Yields the Swing Factor for Crypto?
| Indicator | Last | 1-Day Change | Read for BTC |
|---|---|---|---|
| US 10Y Yield | 5.10% | Slightly lower | Restrictive; the key headwind |
| DXY | 103.68 | ▲ 0.19% | Firm dollar, mild drag |
| S&P 500 | 7,340.53 | ▼ 1.03% | Broad de-risking |
| Nasdaq | 24,328.38 | ▼ 0.74% | Tech under pressure |
| Gold | 3,779.10 | ▼ 2.2% | Even havens sold |
The detail that stands out is gold falling 2.2% on the same day as equities. When the hedge sells off alongside risk assets, it usually points to a liquidity-driven deleveraging rather than a rotation. A 10-year yield above 5% raises the hurdle rate for every non-yielding asset, and Bitcoin is the most rate-sensitive of them. Until the long end rolls over, the macro tailwind that drove past 200WMA rebounds is missing.
Is the Institutional Bid for Bitcoin Weakening?
Strategy, the largest corporate holder of BTC, responded to the $62k crash week by buying preferred stock rather than more Bitcoin. That may well be prudent balance-sheet management. Protecting the capital structure when the equity premium compresses is sensible. Still, the signal matters. For two cycles, Strategy has been the marginal buyer of last resort during drawdowns. If that bid is now conditional on capital-market conditions, the floor under BTC becomes softer.
A weaker corporate bid shifts more of the burden onto spot ETF flows, which tend to follow price rather than lead it. This is another reason to expect a grinding, time-based bottom rather than a sharp reversal fueled by one dominant buyer.
On the regulatory side, a US judge ruled that Ethereum has “no terms of use,” clearing the way in the MIT brothers MEV case. The ruling is narrow, but it adds a datapoint on how courts treat on-chain code: as code rather than as a contract. That is mildly constructive for protocol-level legal clarity. ETH, at $1,812.83, is pinned between support at 1,750 and resistance at 2,000.
What Is Bitcoin Futures Positioning Saying Right Now?
Derivatives positioning shows longs reducing exposure, but the reset is not complete. The long/short ratio has eased to 2.1 from 2.69, with 67.8% of accounts still long. Funding stays positive at +0.0043%, and open interest has dipped only 0.67% in 24 hours. Leverage has not been flushed, which leaves fuel for another liquidation sweep, most plausibly toward $62k.
BTC dominance at 58.44% confirms the risk-off tone, as capital concentrates in the most liquid asset. XRP and SOL bounced about 2.8% on the day, but both remain down 7–10% on the week.
For anyone actively trading these swings, costs add up quickly in a choppy tape. Fee-payback signup links are at the end of the post, and the guides on the BingX 45% fee payback program and the Bitunix 70% fee payback sign-up guide explain how the rebates work.
What Does On-Chain Data Show?
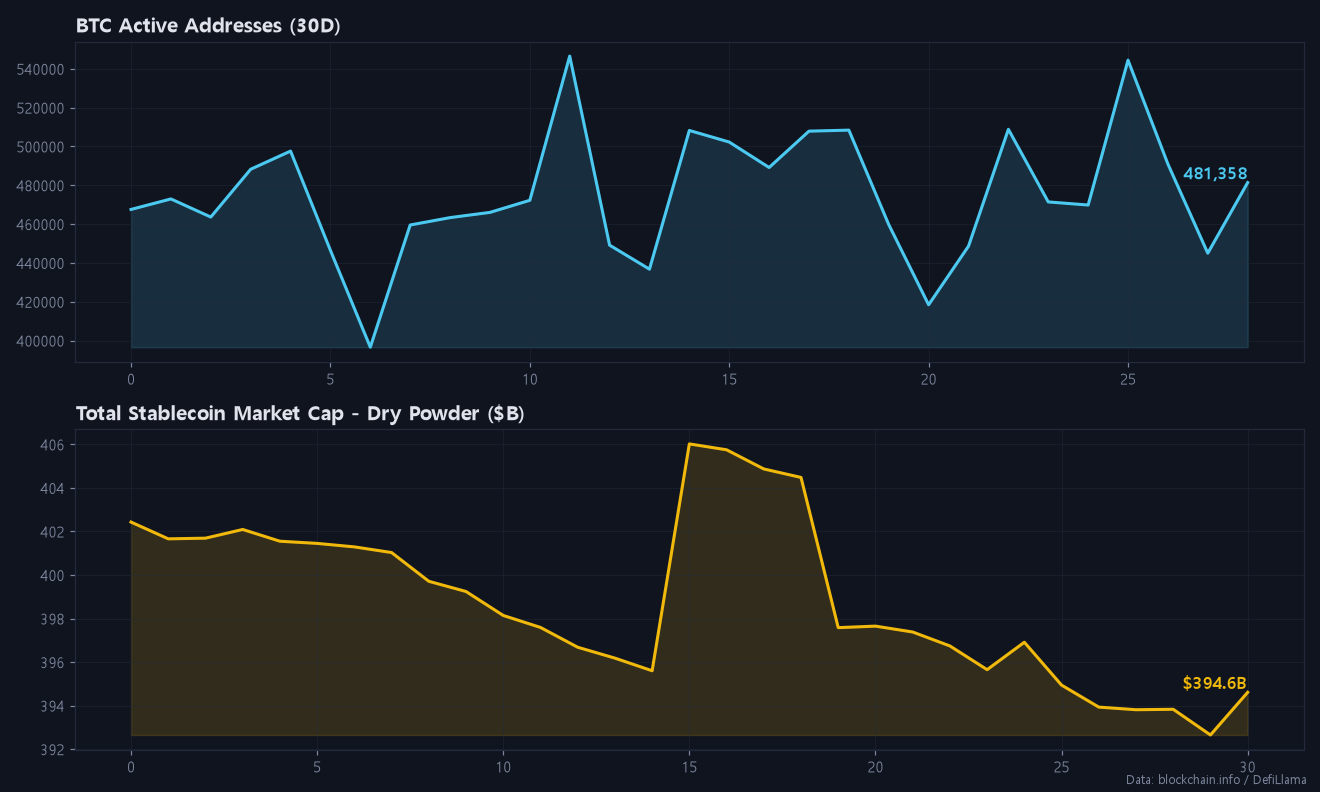
On-chain activity is holding up better than price. Active addresses stand at 481,358, slightly below the 7-day average of 487,380 but 1.3% above the 30-day average, so the user base is not leaving. Transaction count jumped to 810,857, 30.2% above its 30-day average. Hashrate is near 1,099.1 EH/s, up 2.8% over 30 days, which shows miners are not capitulating.
The weak spot is dry powder. Stablecoin market cap has fallen to $394.6B, down $7.82B over 30 days and $1.04B over the week. Shrinking stablecoin supply means less sidelined capital ready to buy dips. Mempool fees at 2 sat/vB also point to little speculative urgency. The on-chain chart below shows the divergence between steady network usage and draining liquidity.
Our View: A Slow Bottom, Not a V
In our view, the 200WMA deviation is a genuine long-horizon opportunity, but the market is pricing it too early. The 2022 analog fits better than 2020: a deep discount paired with restrictive rates and a hesitant marginal buyer. We would expect Bitcoin to spend weeks building a range between roughly $60k and $68k before any serious challenge of $73.5k. The trigger is more likely to be a peak in yields than a crypto-native catalyst.

Positioning framework (not investment advice)
- Tactical short: rallies into 67.5k–68k; invalidation above 69.5k; targets 64k, then 62k.
- Tactical long: only after a sweep below 62k followed by a reclaim; invalidation below 59.5k; target 67.5k.
- Short-term bias: neutral to slightly bearish while funding stays positive and the 10Y holds above 5%.
Risk warning: Extreme Fear readings can trigger violent short squeezes. With leverage still elevated, either side can be liquidated in minutes, so size positions conservatively.
Bitcoin Scenarios: Bull, Base, Bear
| Scenario | Condition | Path |
|---|---|---|
| Bull | 10Y rolls below 4.8%, ETF inflows resume | Clears 68k → retest of $73.5k 200WMA |
| Base | Yields stay near 5%, flows mixed | Range 62k–68k, time-based bottoming |
| Bear | Yields push higher, equities extend losses | Loses 62k → 60k and possibly lower before capitulation |
FAQ
Why is Bitcoin falling this week?
Bitcoin fell 12.59% in seven days as a 5.1% US 10-year yield and a 1.03% drop in the S&P 500 drove broad de-risking across risk assets.
What are today’s key BTC support levels?
The main support is $62,000, the crash-week low, followed by $60k, with resistance at $67.5k–68k and the 200WMA near $73.5k.
Is Bitcoin oversold right now?
By long-cycle measures, yes. BTC is about 12% below its 200-week moving average and the Fear and Greed Index reads 11, although positive funding suggests leverage has not fully reset.
If you found today’s post helpful, please subscribe and like.
Real-time briefings and new-post alerts on Telegram: t.me/corecryptoinsights · Follow on X: @core_trading1
If you’ve been trading without a fee payback, you’ve been losing money this whole time — start getting your trading fees back today.
▶ BingX 45% fee payback — full sign-up guide
▶ Bitunix 70% fee payback — full sign-up guide
▶ BingX vs Bitunix — which saves you more?
Leave a Reply