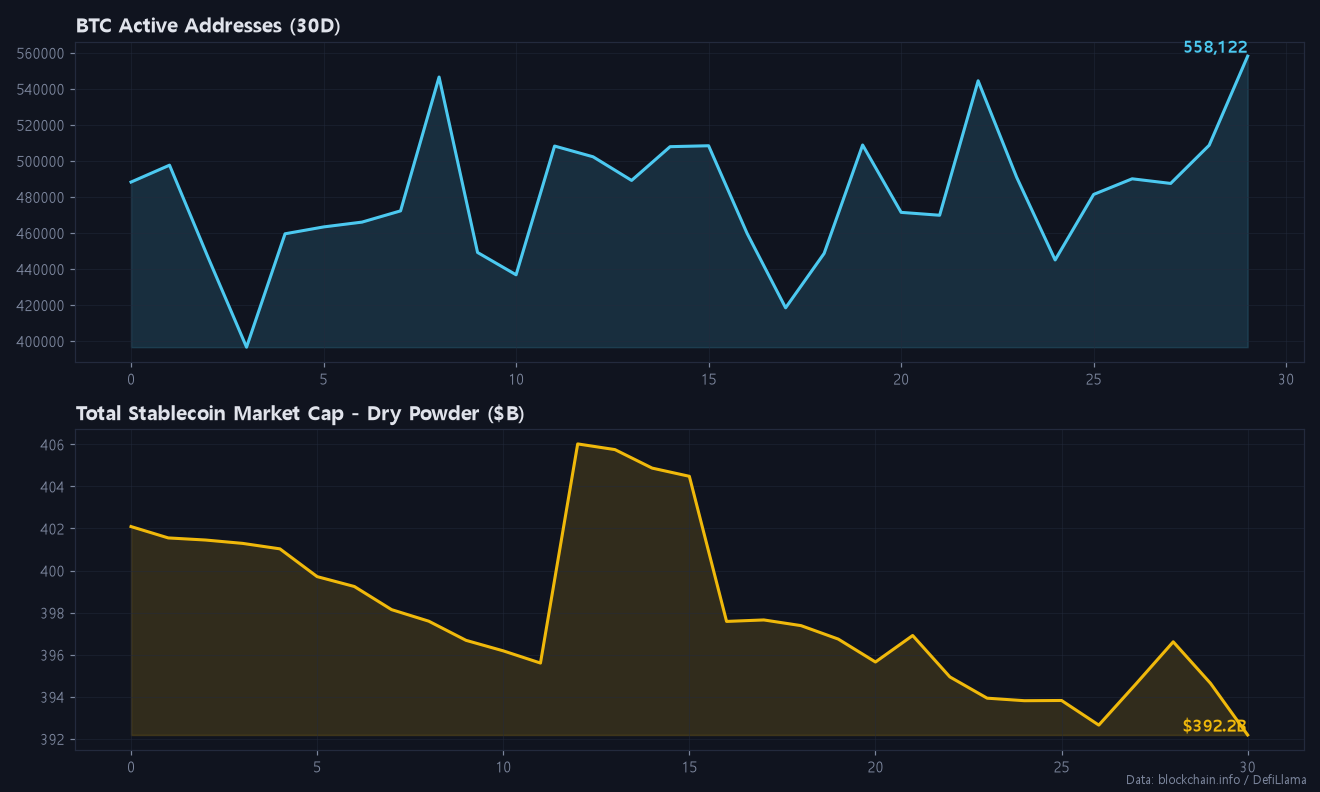
Bitcoin is trading at $60,470.8 on the 1H chart. It bounced roughly 9% off the 48-hour low of $55,126.7 and recovered the $60K pivot. The broader picture is still heavy: seven straight weekly declines, a 7-day high of $66,093.2 far overhead, and price still below the MA60 and MA120.

Indicator Analysis
Moving Averages
Price sits above the MA20 ($58,809.2). It is pinned just under the MA60 ($60,546.9) and well below the MA120 ($62,290.5). The averages are in bearish (inverse) alignment, so this rally is pushing into a declining structure rather than confirming a new uptrend. The MA120 near $62.3K lines up with the upper part of the resistance zone.
→ Short-term recovery inside a bearish MA stack. The MA60 and MA120 act as overhead supply.
RSI
RSI14 reads 79.3, firmly overbought on the hourly. That reflects how fast the bounce from $55K was. Readings this stretched after a capitulation low usually cool off through either sideways chop or a pullback.
→ Overbought. Chasing longs here offers poor reward-to-risk.
MACD
The MACD histogram is +310.7 and above the zero line, which confirms the bounce had real momentum. However, the computed direction flags downside momentum maintaining or strengthening. This suggests the bullish histogram has likely peaked and is starting to roll over.
→ Positive but fading. Watch for a histogram contraction toward zero.
Williams %R
Williams %R at -14.0 sits inside the overbought band (above -20). Price is closing near the top of its recent range. This agrees with RSI that buyers have pushed the move about as far as the short-term range allows.
→ Near the top of the range. Fresh entries favor fading strength over buying it.
ATR
ATR is $629.6, or 1.04% of price, per hourly candle. That is a meaningful but not extreme volatility level after a $7.5K two-day swing. Stops tighter than about 1 ATR are likely to get clipped by noise, so the setups below use stops placed beyond structure plus an ATR buffer.
→ Size positions around roughly $630 hourly swings. Avoid stops under $600 from entry.
CCI
CCI20 at 86.5 is elevated but still below the +100 threshold that typically marks an extended overbought condition. It points to strong upward pressure that has not yet hit a blow-off extreme. That leaves room for a final push into the $61.7K-62.6K area before sellers step in.
→ Strong but not maxed out. A last leg up into resistance is possible.
Stochastic
Stochastic %K is 86.0 and %D is 86.5, both in overbought territory. %K has slipped just below %D, an early bearish crossover signal. It is not confirmed until both lines drop back under 80.
→ Early bearish cross in the overbought zone. Confirmation comes on a move below 80.
Keltner Channel
Price is pressing the upper Keltner band ($60,858.0). The midline is at $59,550.7 and the lower band at $58,243.3. Bollinger Bands tell the same story: price is near the upper band ($61,750.1), and band width is 10.0%. Repeated tags of the upper band in a bearish MA structure tend to resolve with a reversion toward the midline.
→ Upper-band test. The mean-reversion target sits near $59.5K.

On-Chain & Positioning

Funding rate: -0.0043%, slightly negative. Shorts are paying a small premium, which shows the bounce has not yet flipped sentiment to euphoric.
Long/short ratio: 2.24, with 69.1% of accounts long. Retail is still leaning heavily long despite the drawdown. That is crowded positioning that could fuel another flush if $57K gives way.
Open interest: -3.8% over 24 hours while price rose. That combination points to short covering rather than fresh buying, and short-covering rallies often lack follow-through. Hourly OBV confirms it: the 24h trend is falling, with a delta of -54,192 BTC, which suggests distribution into the bounce.
Fear & Greed: 12, Extreme Fear, unchanged from the prior reading. Sentiment is washed out, which supports the case for a tradable long lower down. It does not yet signal a durable bottom.
Macro adds pressure. The Nasdaq fell 5.28% and the S&P 500 fell 3.7% on the day, gold dropped 4.62%, and the US 10-year yield sits at 4.91%. Traders are watching Monday’s equity open closely after more than $1.7B in liquidations across assets. The Korean premium is 2.93%, so local demand has not collapsed.
Today’s Position Strategy
SHORT Setup (Primary)
| Item | Level |
|---|---|
| Entry zone | $62,000 – $63,500 |
| Target 1 | $60,500 (MA60 / pivot) |
| Target 2 | $58,800 (MA20 / Bollinger mid) |
| Target 3 | $57,000 (1st support) |
| Invalidation (stop) | $64,100 (hourly close above $64K) |
The entry zone stacks the 48h swing high ($62,615.4), the MA120 ($62,290.5) and the first resistance at $63.5K. Rallies there meet the heaviest overhead supply. Falling open interest, negative OBV and crowded retail longs all point to a short-covering bounce rather than real accumulation. The stop sits above $64K with roughly an ATR of room beyond resistance, giving about 1:1.7 reward-to-risk to the first target and better to the second.
LONG Setup (Secondary)
| Item | Level |
|---|---|
| Entry zone | $57,000 – $57,800 |
| Target 1 | $60,000 (pivot) |
| Target 2 | $61,750 (Bollinger upper) |
| Invalidation (stop) | $55,000 (below 48h low $55,126.7) |
This is a counter-trend scalp only, built for a pullback into the Ichimoku kijun ($58,052.5), the 24h VWAP ($58,195.6) and the $57K support shelf. Extreme Fear at 12 and slightly negative funding support a bounce from that area. The 69% long-account share means a break of $55.3K could cascade quickly, so the stop below the two-year low is non-negotiable. Keep size smaller than on the short.
This is market analysis, not financial advice. Manage your own risk and position size. Fee-payback signup links for BingX and Bitunix are listed at the end of this post if you want to cut trading costs on these setups.
Conclusion: The bounce to $60K is driven by short covering, so fade strength into $62K-63.5K with a stop above $64K, and treat $57K only as a tactical long zone.
If you found today’s post helpful, please subscribe and like.
Real-time briefings and new-post alerts on Telegram: t.me/corecryptoinsights · Follow on X: @core_trading1
If you’ve been trading without a fee payback, you’ve been losing money this whole time — start getting your trading fees back today.
▶ BingX 45% fee payback — full sign-up guide
▶ Bitunix 70% fee payback — full sign-up guide
▶ BingX vs Bitunix — which saves you more?
Leave a Reply