Not blindly. Bitcoin touched roughly $55,326, a two-year low, and has bounced to about $58,987. Gold, the Nasdaq and the S&P 500 fell with it, which points to forced selling. Buying makes more sense after the forced sellers are exhausted. Funding at +0.0066% and 69.9% long accounts suggest that has not happened yet.

Bitcoin’s slide to a two-year low is the headline, but it is the less important part of the story. Bitcoin is down 8.45% on the week even after reclaiming the $60K area intraday. The more important fact is what fell alongside it. Gold dropped 4.62% to $3,515. The Nasdaq lost 5.28%. The S&P 500 shed 3.7%. The Fear and Greed Index sits at 11, deep in Extreme Fear. When the safe haven and the risk asset fall on the same day, investors are not picking winners. They are raising cash.
So this piece reframes the question readers keep asking. Instead of ‘Should I buy Bitcoin here?’, the better question is ‘Who still has to sell?’
Why did gold fall with Bitcoin?
Gold falling nearly 5% during a risk-off day looks strange until you think about margin. When equity portfolios take a 5% hit on leveraged books, prime brokers issue margin calls. Funds then sell what they can, not what they want to. Gold is liquid and has been sitting on large gains, so it gets sold first. Bitcoin falls into the same category: deep markets that trade around the clock.
The crypto side added its own accelerant, a roughly $1.8B liquidation wave as leveraged longs were stopped out on the way to $55.3K. Open interest has fallen 4.33% over the past 24 hours. The bounce is real, but it was driven by positions closing, not by fresh buyers.
The bond market offers one partial relief signal. The 10-year Treasury yield eased to 4.91%, and the dollar index barely moved (103.81, -0.09%). A dollar that is not spiking means this is not yet a full global funding squeeze. It looks more like a deleveraging event inside crowded trades.

Are leveraged crypto treasury companies the next forced sellers?
This is where the stress is building quietly. Digital asset treasury companies, the listed firms that borrowed to hold crypto on their balance sheets, were a major source of demand on the way up. On the way down, they can become a source of supply.
BTCS is the clearest example. The company has warned the SEC that its $54M loan on Aave could face liquidation if collateral values keep falling. That is a public admission that a price level exists at which the company stops being a holder and becomes a seller, and the seller in that case is a smart contract. DeFi liquidations do not negotiate or wait for a better market.
The concern is not one company. Treasury firms tend to share the same playbook, using convertible notes, collateralized loans and equity raised at a premium to net asset value. When that premium collapses, the cheapest source of funding disappears. Firms whose loans are marked against crypto collateral face a simple choice: post more collateral, repay, or be liquidated. That structural supply hangs over the market until those balance sheets are de-risked.
Does record Q3 ETF ownership mean institutions are buying this dip?
The bullish headline is that US institutional holdings of spot Bitcoin ETFs hit a record in Q3, with managers turning to net buyers. That is true. It is also a picture of where institutions stood on the last day of September.
13F filings are backward-looking by design. They are filed weeks after the quarter closes and show nothing about what happened during this drawdown. A hedge fund that reported a large ETF position in Q3 may have been running a basis trade, holding the ETF while shorting futures. That position is market-neutral and can be unwound in a day. Record ownership also means record potential supply if the same managers face redemptions.
The flows that matter right now are daily ETF creations and redemptions, not quarterly snapshots. Until daily flows turn positive during a down day, the 13F headline should be read as context, not as a signal to buy.
What do the Chainflip hack and the Bitcoin node bug say about systemic risk?
Chainflip’s roughly $12M exploit is small in dollar terms but poorly timed. Hacks during liquidity stress tend to accelerate withdrawals from cross-chain bridges and DeFi protocols, which in turn thins out the collateral pools that leveraged players depend on. The reported Bitcoin node bug belongs in a different category. Node software issues are usually patched without drama, but in an Extreme Fear market, headlines about protocol flaws give nervous holders one more reason to step aside.
Neither event is systemic on its own. Together, they add friction at the worst possible moment, when the market needs confidence for buyers to step in.
Why are Monero and a ruble stablecoin rallying?
Look at the gainers list and a different story appears. Monero rose 10.06% to $483.18. A7A5, the ruble-linked stablecoin, jumped 195.17%. This comes as Russia’s crypto regulatory regime goes live, with pilot trading reportedly planned for December 1.
This is a regional, sanctions-adjacent flow, not a broad risk-on signal. Capital that needs to move across borders outside the dollar system is positioning ahead of a formal framework. It is useful as a reminder that crypto demand is not monolithic. Some buyers care about privacy and access, not ETF flows or Nasdaq correlation, and they do not get margin-called by prime brokers.
What does on-chain data say about Bitcoin right now?
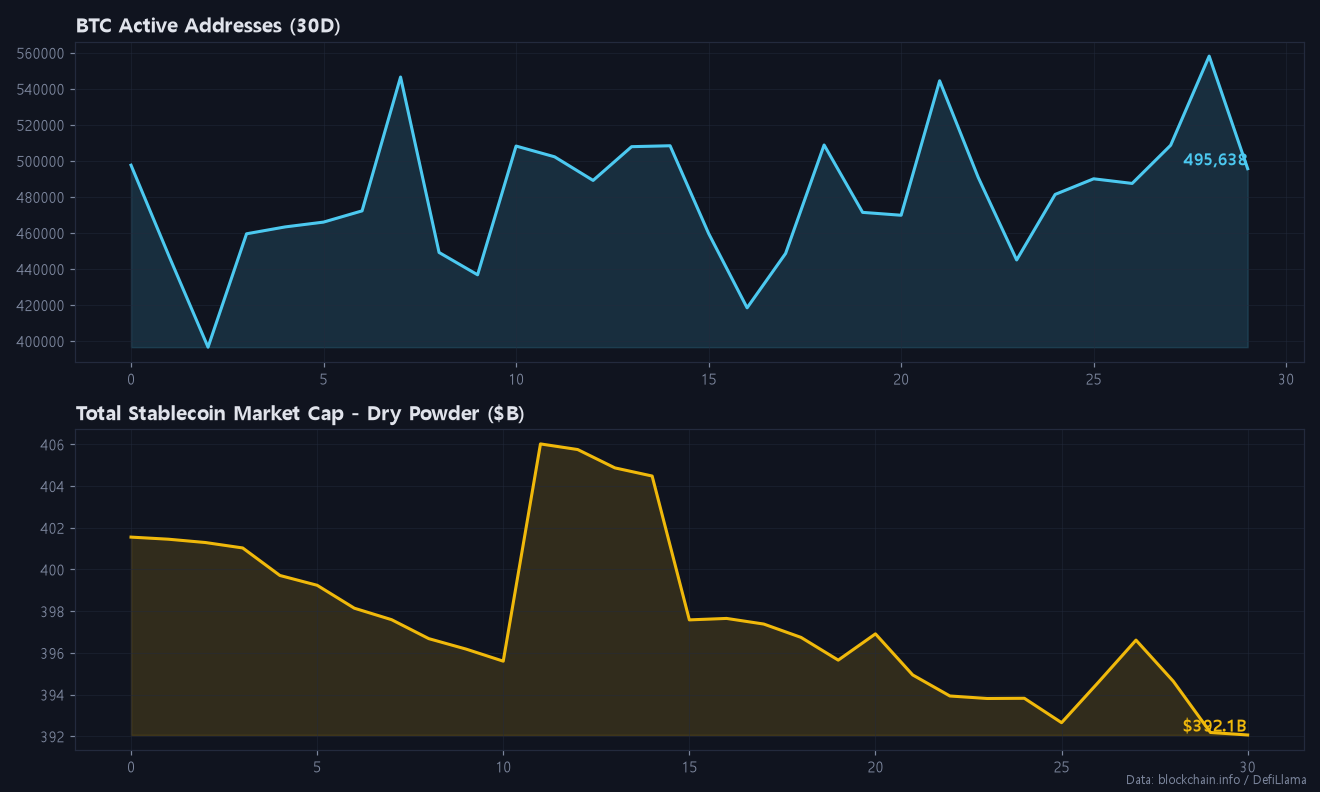
The network itself looks steadier than the price. Active addresses came in at 495,638, up 3.1% versus the 30-day average, and transaction count reached 638,018, up 3.6%. Users did not leave during the crash. The 30-day address series has held in a range of roughly 400K to 560K throughout the selloff.
The less comforting data point is dry powder. Total stablecoin market cap stands at $392.1B, down $1.75B on the week and $9.48B over 30 days. Shrinking stablecoin supply means capital is leaving crypto rather than waiting on the sidelines in dollar tokens. That matters, because sustainable recoveries usually start with stablecoin balances growing.
Hashrate is at 1,099.1 EH/s, down 9.6% over 30 days. Miners switching off less efficient machines is consistent with margin pressure at these prices, and miners are another group that can be forced to sell coins to cover costs. Mempool fees at just 1 sat/vB confirm there is no on-chain rush either way. The chart below shows active addresses holding flat while stablecoin supply drifts lower.
What are today’s key BTC support levels?
| Level | Role | Why it matters |
|---|---|---|
| $64,400 | Trend-change resistance | Weekly open area; reclaiming it flips the structure |
| $60,000 – $61,500 | First resistance | Breakdown zone, now overhead supply |
| $57,000 | First support | Intraday base of the rebound |
| $55,300 | Key support / invalidation | Two-year low from the liquidation wick |
Futures positioning is the problem. Despite the crash, funding is still positive at +0.0066%, the long/short ratio is 2.32, and 69.9% of accounts are long. In a genuine capitulation, funding turns negative and the crowd flips short. Right now, retail is still buying the dip with leverage, so the leverage that needs to be cleared has not been cleared yet.
Trading scenarios
- Bearish lean (base case): Neutral to lightly short below $60,000-$61,500. Invalidation above $64,400. Targets $57,000, then a retest of $55,300.
- Long setup (conditional): Scale in only on a $55,300 retest that holds and funding flipping negative. Invalidation on a decisive break below $55,300. Targets $60,000, then $64,400.
- No trade: Chop between $57K and $60K with positive funding offers poor risk/reward for either side.
If you are scaling into positions over several entries, fees add up quickly. The fee-payback signup links are at the end of this post, and you can also compare the BingX 45% fee payback guide with the Bitunix 70% fee payback sign-up guide before choosing where to trade.
How to tell forced selling from voluntary selling
Instead of reading the chart candle by candle, watch these four tells:
- Correlation: When gold, equities and BTC fall together, the selling is forced. Bitcoin decoupling to the upside while gold stabilizes would suggest that forced selling is ending.
- Funding and positioning: Forced selling ends when funding goes negative and long-account share drops well below 70%.
- Open interest: A falling price with falling OI means liquidations. A stable price with rising OI and negative funding means shorts are crowding in, which is fuel for a squeeze.
- Balance-sheet headlines: Watch for more SEC filings like BTCS’s. Each one marks a price at which someone has no choice but to sell.
My view: I would not buy Bitcoin aggressively at $59K. The two-year low is not the bottom signal. The bottom signal is the last forced seller leaving, and positive funding with a 2.32 long/short ratio says the crowd is still leaning the wrong way. I expect at least one more test of the $55K-$57K zone before a durable base forms, and I would rather pay a little more after confirmation than catch the final liquidation.
Risk warning: Cross-asset liquidations can overshoot technical levels by a wide margin. If equity margin calls deepen or a treasury company’s DeFi loan is liquidated on-chain, $55,300 may not hold. Size positions so that a gap below support does not become your own forced sale.
FAQ
Why is Bitcoin falling today?
Bitcoin dropped to about $55,326 in a broad dash for cash, alongside gold (-4.62%) and the Nasdaq (-5.28%), with roughly $1.8B in leveraged positions liquidated.
Is Bitcoin at a bottom?
Not confirmed. Funding is still positive at +0.0066% and 69.9% of accounts are long, so the leverage has not been fully flushed.
What is the key Bitcoin level to watch?
$55,300 is the critical support. On the upside, reclaiming $64,400 would signal a trend change, while $60,000-$61,500 is the first resistance zone.
If you found today’s post helpful, please subscribe and like.
Real-time briefings and new-post alerts on Telegram: t.me/corecryptoinsights · Follow on X: @core_trading1
If you’ve been trading without a fee payback, you’ve been losing money this whole time — start getting your trading fees back today.
▶ BingX 45% fee payback — full sign-up guide
▶ Bitunix 70% fee payback — full sign-up guide
▶ BingX vs Bitunix — which saves you more?
Leave a Reply