Bitcoin is falling today because macro pressure and supply-side stress are hitting at once. BTC trades near $68,820, down 3.63% in 24 hours and 9.23% on the week. That puts it on track for a sixth straight weekly loss, with the 10-year Treasury yield at 5.15%, a firmer dollar and a 17.4% hashrate drop adding to the weight.

Six red weekly candles in a row is rare, and it rarely happens without a story behind it. This time the story is capital rotation. Anthropic’s blockbuster IPO has given growth-hungry money a fresh, regulated place to park risk appetite. The timing is poor for crypto, because the rate backdrop is already hostile. Bitcoin now sits at a 12-week low, and the Fear & Greed Index has slid to 20 (Extreme Fear), down from 28 a day earlier.
Headlines will focus on the IPO and on rates. The more interesting signal is coming from the miners, so that is where most of this analysis goes.
Why is Bitcoin falling this week?
Start with the macro layer. The US 10-year yield is at 5.15%, up 1% on the day. The dollar index has climbed to 103.43 (▲0.25%), and one recent report described it as a 19-month high. Equities are softening too. The Nasdaq fell 0.91% to 25,136 and the S&P 500 slipped 0.4% to 7,561. Gold barely moved at 3,879.9, so this does not look like a classic flight to safety. Investors are repricing duration and growth.
When the risk-free rate pays above 5% and a high-profile AI listing absorbs speculative capital, the marginal buyer of crypto disappears. That is the rotation narrative in one sentence.
The weakness is broad across majors. Ethereum is at $1,945.7 (▼12.85% on the week), XRP is at $1.022 (▼13.77%) and Solana is at $79.85 (▼11.3%). BTC dominance holds at 58.94%, which tells you altcoins are bleeding faster than BTC. That pattern fits deleveraging, not rotation inside crypto. Small pockets of strength are scattered. Injective is up 9.68% and Hyperliquid is up 1.16% on the day, but neither changes the overall tape.
What does the 17% hashrate drop mean for Bitcoin?
Network hashrate has fallen to roughly 878 EH/s, down 17.4% in 30 days. A move that size is not noise. It usually means some miners are switching off machines because the hashprice no longer covers power costs, or they are relocating under financial stress.
Analysts track this through the hash ribbon. That signal compares the 30-day and 60-day moving averages of hashrate. When the short average crosses below the long one, it flags miner capitulation. Past episodes, such as late 2018, March 2020 and the second half of 2022, lined up roughly with major cycle lows. The catch is that the bottom usually came during the late stage of the capitulation window, not at its start. Price often fell further while miners sold reserves to stay solvent.
That is the open question now. Is this hashrate slide the end of forced supply, or the beginning of it? History offers no clean answer, only a sequence. First comes capitulation, then hashrate stabilizes, and only then comes a durable recovery. We are clearly in the first phase.
The supply-side stress goes beyond miners. Metaplanet’s BTC sale is a small but symbolic shift. Corporate treasury holders were the steady bid of the last cycle, and some are now selling into weakness rather than buying it. If others follow, the market loses a structural buyer just as miners turn into sellers.
On-chain data: activity, liquidity and the miner picture
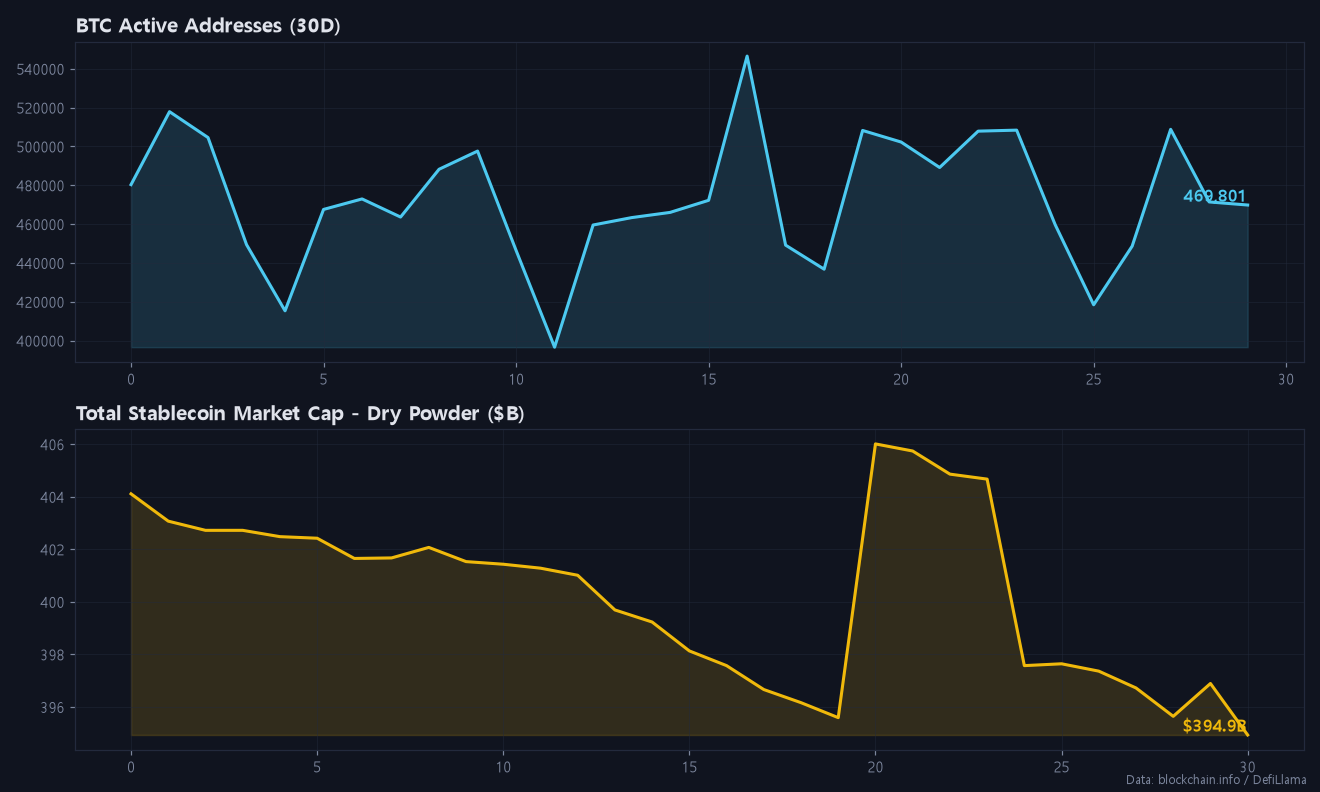
The on-chain picture looks less like panic and more like quiet withdrawal. Active addresses sit at 469,801, essentially flat against the 7-day average of 469,302 and 0.7% below the 30-day average. Users have not fled, but they are not arriving either. Transaction count is weaker at 472,840, down 25.1% versus its 30-day average. The mempool fast fee is just 3 sat/vB, a sign of a network with little urgency.
Total stablecoin market cap stands at $394.9B, down $9.18B over 30 days. That leaves less dry powder on the sidelines to absorb sell pressure, so a reversal would likely need fresh inflows rather than redeployed cash. Combine that with the 878 EH/s hashrate reading and the supply side looks fragile, while the demand side looks hesitant.
As the on-chain chart above shows, address activity has bounced around a stable range all month. Hashrate and liquidity, by contrast, have trended lower. That divergence matters. A bottom usually needs participation to rise while supply stress fades, and right now we have neither.
What are today’s key BTC support and resistance levels?
The $70,000 handle has flipped from support to resistance. It is now the first ceiling any bounce has to clear. Above that, $72,000 marks the line between a bear-market relief rally and a real structural repair. On the downside, the intraday low around $67,000 is the immediate floor.
The bear-market-low thesis gets tested at $65,000. This zone has the most historical volume and the most psychological weight. Prediction markets moved sharply this week as well, with odds of BTC trading at $65k by year-end jumping 31 points to 66%. If $65k breaks on a closing basis, momentum gauges that have already turned red would point toward $60,000 as the next breakdown target.
| Asset | Support | Resistance | Price now |
|---|---|---|---|
| BTC | $67k / $65k / $60k | $70k / $72k | $68,820 |
| ETH | $1,900 | $2,100 | $1,945.7 |
| SOL | $75 | $88 | $79.85 |

As the chart shows, the lower highs since the last swing peak are intact. Each bounce has stalled below the previous one, and the latest leg sliced through $70k without a meaningful retest. The structure stays bearish until that sequence breaks.
Futures positioning: why the flush isn’t finished
Roughly $1.6B in liquidations sounds like a cleanout, but positioning says otherwise. Funding is still positive at +0.0081%. The long/short ratio is 3.09, with 75.5% of accounts on the long side. That is a crowd still betting on a bounce. True capitulation usually shows up as negative funding and a collapsing long ratio, and neither has happened yet. As long as that long-heavy setup persists, any break of support risks a cascade of long liquidations.
Trade scenarios
- Primary (short bias): Fade rallies into the $70k-$72k zone. Stop above $72.5k. First target $67k, then $65k.
- Trend continuation short: On a confirmed close below $65k, look for continuation toward $60k. Trail the stop to just above $66.5k once the breakdown holds.
- Counter-trend long (tactical only): Extreme fear near $65k can produce sharp technical bounces. A small long on a clear reclaim of $65.5k after a wick, with a stop below $63.8k, targets $68k-$70k. Size it small and take profits quickly.
Active short-term trading adds up in fees, especially when you scale in and out around levels like these. If you trade on BingX, the BingX 45% fee payback guide explains how to recover part of those costs. Bitunix users can check the Bitunix 70% fee payback sign-up guide. Fee-payback signup links for both are also at the end of this post.

My take: capitulation is starting, not ending
My view is that we are early in the capitulation process, not at its end. A 17% hashrate drop with positive funding and a 75% long crowd does not look like exhaustion to me. To me it looks like a market where miners and treasuries have started selling but leveraged traders have not given up. I expect $65k to be tested, and I would not be surprised by a wick toward the low $60s before the hash ribbon flips back up. The best long opportunity likely comes after hashrate stabilizes, not before.
Risk warning: extreme fear readings can trigger violent short squeezes. A softer yield print or a pause in dollar strength could send BTC back to $72k within days. Keep leverage modest, define stops before entry and never risk capital you cannot afford to lose.
What would invalidate the bearish structure?
- A daily close above $72,000: this breaks the lower-high sequence and turns $70k back into support.
- Yields easing: a 10-year move back below 5% would ease the rate headwind and weaken the rotation narrative.
- Hashrate recovery: a rebound from the 878 EH/s area, with the 30-day average curling back up, would signal that miner selling is fading.
- Positioning reset: funding flipping negative and the long ratio falling sharply would show that the crowd has actually been flushed.
Two or more of these together would make a real case for a bottom. Until then, rallies look like selling opportunities.
FAQ
Is Bitcoin in a bear market right now?
The structure is bearish. BTC is at $68,820 after six straight weekly losses, and the $65k zone is now the key test of the bear-market lows.
Does a hashrate drop mean the Bitcoin bottom is in?
Not on its own. Hashrate is down 17.4% to about 878 EH/s, and history suggests bottoms tend to form once hashrate stabilizes, not while it is still falling.
What level would flip the outlook bullish?
A daily close above $72k, ideally alongside the 10-year yield easing from 5.15%, would invalidate the current bearish setup.
If you found today’s post helpful, please subscribe and like.
Real-time briefings and new-post alerts on Telegram: t.me/corecryptoinsights · Follow on X: @core_trading1
If you’ve been trading without a fee payback, you’ve been losing money this whole time — start getting your trading fees back today.
▶ BingX 45% fee payback — full sign-up guide
▶ Bitunix 70% fee payback — full sign-up guide
▶ BingX vs Bitunix — which saves you more?
Leave a Reply