BTC is trading at $64,951.5 on the 1H chart. The 48-hour range runs from $61,956 to $66,093, and price is now in the middle of it. That is a long way below last week’s $75,411 high. The bounce from the $62K flush has stalled right at the MA60, and sentiment is still pinned at Extreme Fear.

Wall Street had a rough session: the Nasdaq fell 2.49% and the S&P 500 fell 1.92%. Headlines are full of crypto-equity selling and warnings about what happens if $60K breaks. This is a market that wants to bounce but has not earned it yet.
Indicator Analysis
Moving Averages
Price sits above the MA20 ($64,724) but just under the MA60 ($64,961). It is far below the MA120 ($67,681). The stack is in bearish order, so the short-term recovery is happening inside a larger downtrend. The MA60 is the first real test, and it is capping price right now.
→ Short-term bid, but the bigger structure still favors sellers until $67.7K is reclaimed.
RSI (14)
RSI is at exactly 50.0, a dead-neutral reading. The oversold pressure from the drop to $62K has been fully worked off. Momentum has no edge in either direction from here.
→ No signal on its own; price action at the range edges will decide.
MACD
The histogram is still positive at 78.2 and above the zero line, which reflects the rebound off the lows. However, the computed momentum direction flags bearish pressure building, meaning the upside push is losing energy. A positive histogram with that flag often comes before a rollover.
→ Bullish momentum is fading; watch for the histogram to shrink toward zero.
Williams %R
Williams %R reads -40.2, in the middle of its range and closer to the upper half. Price is neither stretched nor washed out. It leaves room for a move toward the top of the range before overbought conditions appear.
→ Neutral, with modest room left for a push toward $66K.
ATR
The 1H ATR is $563.3, or 0.87% of price. That is a normal hourly swing for BTC after a volatile week. Stops tighter than about one ATR from entry are likely to get clipped by noise.
→ Size positions so a stop of roughly 1.5 ATR (about $850) is tolerable.
CCI (20)
CCI sits at 74.6, positive but below the +100 overbought threshold. This confirms price is trading above its recent mean without being overextended. A push above 100 would line up with a test of the upper Keltner band.
→ Mild upside bias in the short term, not yet stretched.
Stochastic
%K at 59.8 has crossed below %D at 62.7 in mid-range. A bearish cross at these levels is not a strong sell signal, but it shows short-term buying is already cooling. It agrees with the MACD read.
→ Early sign of the bounce running out of steam.
Keltner Channel
Price trades above the Keltner midline ($64,805). The upper band is at $66,028 and the lower band at $63,581. The upper band sits almost exactly on the 48-hour high of $66,093, which makes $66K a clear resistance cluster.
→ $66.0K–66.1K is the zone to watch for rejection; $63.6K is the downside magnet.

On-Chain & Positioning
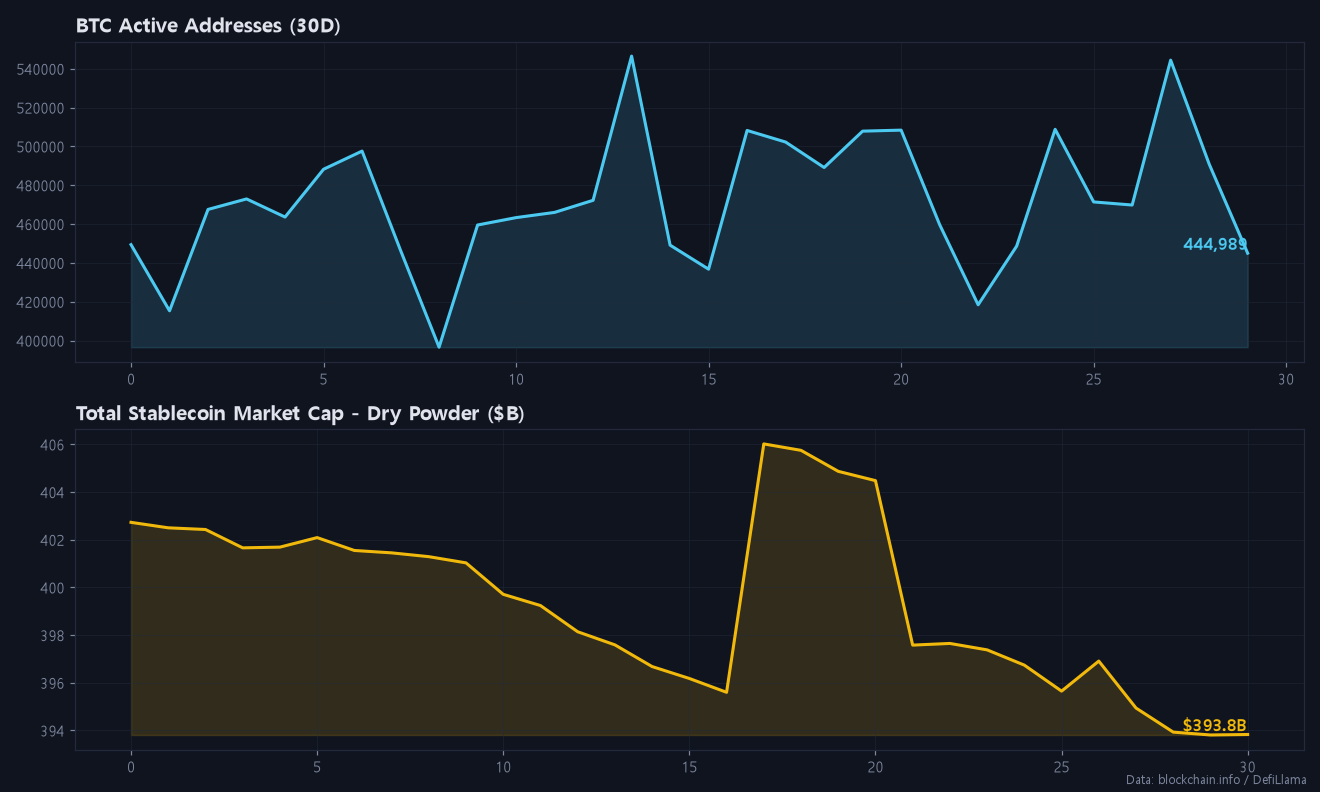
Stablecoin supply is shrinking. Less dry powder is sitting on the sidelines. That weakens the case for a strong spot-driven recovery while risk assets are under pressure.
Elsewhere, the 24h OBV trend points to distribution, with a delta of -4,667 BTC. Selling volume has outweighed buying even as price bounced. Price does sit 0.36% above the 24h VWAP ($64,717), so intraday buyers still hold a slight edge.

- Funding rate: 0.0056%. This is positive but below the 0.01% baseline, so leverage is not overheated.
- Long/short ratio: 2.69. Longs make up 72.9% of accounts, a heavy one-sided crowd that becomes fuel if $62K gives way.
- Open interest: -0.76% over 24h. That is a small decline: some positions were closed, but there has been no major washout yet.
- Fear & Greed: 10 (Extreme Fear), unchanged from yesterday. Readings like this often appear near local lows, but they can persist for days during macro stress.
The Korean premium stands at 2.24%, which shows retail demand in Korea has not capitulated. That fits a crowd that is still buying dips.
Today’s Position Strategy
SHORT Setup (Primary)
| Entry Zone | Targets | Invalidation (Stop) |
|---|---|---|
| $65,900 – $66,300 | T1 $64,720 / T2 $63,580 / T3 $62,000 | $67,050 (1H close above) |
The entry zone stacks the upper Keltner band ($66,028) with the 48-hour swing high ($66,093). It sits under the bearish MA alignment, while OBV is still showing distribution. With 72.9% of accounts long and the Nasdaq down 2.49%, a rejection here could drive price back to $62K. A break there would trigger cascading long liquidations.
If price instead squeezes straight to the $67.5K resistance near the MA120, that becomes a second, higher-quality short area. Do not chase shorts at current prices.
LONG Setup (Secondary)
| Entry Zone | Targets | Invalidation (Stop) |
|---|---|---|
| $62,000 – $62,500 | T1 $63,580 / T2 $64,720 / T3 $66,000 | $61,150 (1H close below) |
The $62K area is the recent swing low ($61,956). That is where Extreme Fear and low funding make a contrarian bounce plausible. This is a counter-trend trade, so take partial profit at T1 and move the stop to breakeven.
If $62K fails and open interest drops sharply, wait for a flush toward $60K before considering longs again. Do not average down.
Everything here is market analysis, not financial advice, so size your risk to your own account. Fee-payback sign-up links for BingX and Bitunix are listed at the end of this post for anyone who wants to cut trading costs on these setups.
Conclusion: Neutral-to-bearish bias. Sell rejections at $66K, and buy only a defended $62K with tight stops.
If you found today’s post helpful, please subscribe and like.
Real-time briefings and new-post alerts on Telegram: t.me/corecryptoinsights · Follow on X: @core_trading1
If you’ve been trading without a fee payback, you’ve been losing money this whole time — start getting your trading fees back today.
▶ BingX 45% fee payback — full sign-up guide
▶ Bitunix 70% fee payback — full sign-up guide
▶ BingX vs Bitunix — which saves you more?
Leave a Reply