Not with full size. Bitcoin trades near $64,567, down 13.68% on the week, while Wells Fargo’s reported IBIT stake doubled to $2.35B. The long-term bid is real, but Nvidia earnings and a 5.12% 10-year yield make a staged entry safer than one lump-sum buy before the report.

A reader asked this morning: “Wells Fargo is buying IBIT. Should I buy bitcoin ETFs before Nvidia earnings?” The question makes sense. Reported Wells Fargo holdings of BlackRock’s spot Bitcoin ETF doubled to roughly $2.35 billion during a week when BTC fell about 14%. One of the largest US wealth platforms added exposure into weakness. Retail investors want to know whether to follow.
The honest answer depends on your timeframe. Institutional accumulation moves slowly, over quarters. Nvidia’s earnings and real yields move fast and decide where a good entry price sits this week. This piece looks at each timeframe separately.
Part 1: Why Are Banks Buying Bitcoin ETFs While Prices Fall?
Wirehouse adoption differs from a hedge fund trade. When a bank’s advisory channel holds a spot ETF, it usually means the product has passed internal due diligence and model-portfolio reviews, and advisors can now recommend it. That process takes months. It rarely reverses because of one bad week.
The doubling of the IBIT position matters less for the dollar amount than for what it signals. Advisor channels allocate in small percentages across very large client bases, and they rebalance on a schedule. Rebalancing that buys after drawdowns adds steady, price-insensitive demand that can last several quarters. It will not stop a liquidation cascade. It does tend to absorb supply after one.
The structural bull case, in short form:
- Big-bank platforms are adding spot BTC exposure during a drawdown, not only during rallies.
- Advisor demand works on a calendar, so it is less reactive to short-term headlines.
- BTC dominance at 58.41% shows capital concentrating in the asset these ETFs hold, not drifting out along the risk curve.
Even so, this demand buys gradually. It does not set this week’s floor.

Part 2: Can Nvidia Earnings Push Bitcoin Below $60K?
It can. Over the past year, crypto has traded as part of the broader AI-and-liquidity complex. When the Nasdaq sells off, BTC usually follows. In the latest session the Nasdaq fell 2.49% to 24,509.76 and the S&P 500 dropped 1.92% to 7,416.59. Nvidia reports into that weakness, so the result is close to binary. A strong beat-and-raise could set off a relief rally across risk assets. A disappointment would hit the same leveraged positions that hold growth stocks and crypto.
Rates are the other problem. The 10-year Treasury yield sits at 5.12%. It eased 0.64% on the day but remains at a level that competes directly with non-yielding assets. The dollar index is roughly flat at 103.51, and gold is up 0.71% to $3,880.4. Defensive money is moving into the traditional hedge rather than bitcoin.
The derivatives data adds to the caution. Here is how positioning looks:
| Metric | Reading | What it implies |
|---|---|---|
| Long accounts | 74.1% | Retail longs crowded |
| Long/short ratio | 2.86 | Downside flush risk |
| Funding rate | 0.0011% | No fresh leveraged buying |
| Open interest (24h) | ▼ 0.79% | Positions closing, not building |
| Fear & Greed | 12 (prev 10) | Extreme fear, squeeze possible |
Most accounts are long, but funding is close to zero and open interest is shrinking. Many traders are holding underwater longs, and nobody is adding leverage to lift price. A weak Nvidia print could force those longs out, and the level to watch is $60,000.
What Are Today’s Key Bitcoin Support Levels?
- $62,000: weekend low and first support
- $60,000: major psychological line, with a break likely to speed up liquidations
- $67,500: first resistance
- $70,000: second resistance, where the trend would start to repair
- ETH: support $1,750, resistance $2,000 (now $1,827.46, down 14.05% for the week)
What Is On-Chain Data Saying?
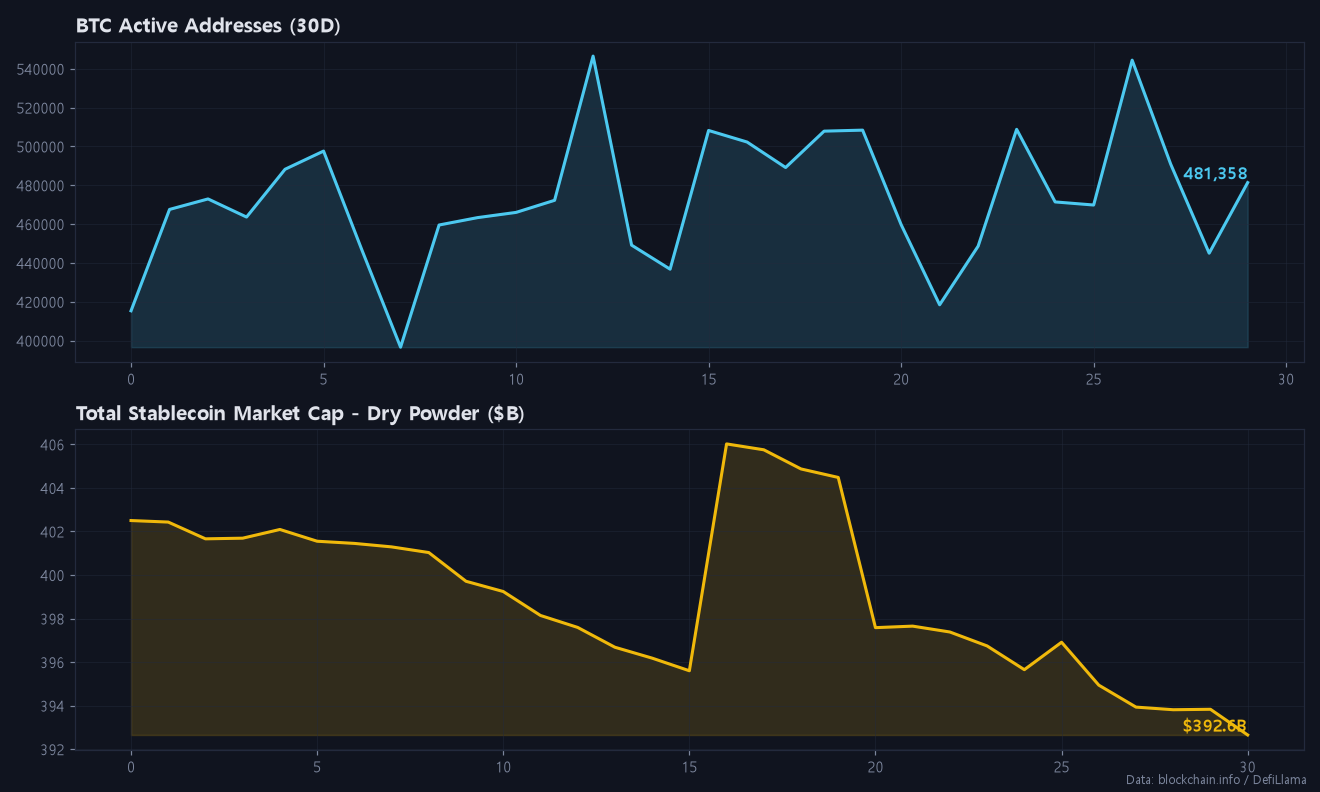
The network itself is not breaking down. Active addresses are at 481,358, slightly below the 7-day average of 487,380 but 1.7% above the 30-day average. Usage is steady and has not collapsed alongside price. Transaction count is up 30.1% versus the 30-day average at 810,857. Some of that likely reflects coins moving during the sell-off, including possible exchange deposits, so treat it as mixed rather than bullish. Fees are low, with fast inclusion at 3 sat/vB, so the mempool is not congested.
Hashrate is 1,099.1 EH/s, down only 0.5% over 30 days. Miners are not capitulating at these prices. The stablecoin data is less encouraging. Total stablecoin market cap fell to $392.7B, down $4.08B over seven days and $9.84B over 30 days. Stablecoins act as the market’s dry powder, and that pool is shrinking. Capital is leaving crypto rather than waiting on the sidelines to buy the dip.
The chart above shows the pattern: address activity holds in a range while the stablecoin supply line slopes down. Fundamentals look fine, but liquidity is thinning.
Part 3: Regulatory and Integrity Headlines Weighing on Sentiment
Three stories are adding to the gloom. None of them changes the market structure on its own, but together they make buyers more hesitant:
- Hyperliquid insider plea: A former Robinhood engineer pleaded guilty to insider trading on Hyperliquid. This raises questions about the integrity of on-chain perps venues, although HYPE is up 5.56% on the day at $69.61.
- CFTC versus the Senate: Senate Democrats are pushing back on the CFTC’s approach to prediction markets. This points to more regulatory friction around crypto-adjacent products in the US.
- Evernorth’s XRP writedown: Ripple-backed Evernorth wrote down its XRP holdings by 60%. Treasury-company models look fragile in a drawdown. XRP is at $0.959, down 12.8% on the week.
Headlines like these mostly affect sentiment. They make dip-buyers wait longer, so bounces tend to be shallower until a clear catalyst appears.
How Should I Trade Bitcoin Around Nvidia Earnings?
For active traders, my desk leans slightly short and sells rallies, but does not chase breakdowns:
- Short scenario: Sell into the $67,000 to $68,000 zone. Stop above $70,500. Targets $62,000, then $60,000. With crowded longs and flat funding, rallies into first resistance offer the best risk/reward.
- Long scenario: Only after a flush to $60,000 to $62,000 that holds on a closing basis following earnings. Stop below $58,800, target $67,500. With a Fear & Greed reading of 12, a sharp short squeeze is possible, which is why chasing shorts below $60K is risky.
Execution costs matter more when you trade both sides of a choppy range. If you use derivatives, compare maker/taker rates and look at how BingX’s 45% fee payback works or the Bitunix 70% fee payback sign-up guide. Fee-payback signup links are also at the end of this post.
So, Should You Follow the Wirehouses Into Bitcoin ETFs?
My answer is to follow them, but at their pace rather than all at once. Wells Fargo is not putting its full allocation in the night before a binary macro event, and you don’t need to either. I would put about one-third of the planned ETF allocation in before earnings. That gets you exposure if a strong Nvidia print triggers a squeeze, and the downside stays limited if it doesn’t. I would add the second third only if BTC reclaims $67,500 after earnings, or if it tests $60,000 to $62,000 and holds. The last third goes in over the following weeks, regardless of price, much like an advisor rebalancing schedule. Long-term buyers who match the institutions’ patience should end up with a better average entry than anyone trying to time the exact bottom this week.
Risk warning: If $60,000 breaks on heavy volume after earnings, liquidations among 74.1% long accounts could carry price well below that level before ETF demand absorbs the supply. Size every tranche so that kind of overshoot doesn’t force you out. Nothing here is personal financial advice.
FAQ
Is Wells Fargo buying Bitcoin?
Reported filings show Wells Fargo’s IBIT holdings doubled to about $2.35B, even as BTC fell roughly 14% on the week.
What is Bitcoin’s most important support right now?
The weekend low of $62,000 is first support, and $60,000 is the key psychological line ahead of Nvidia earnings.
Is the crypto market oversold?
Sentiment is extreme, with Fear & Greed at 12. Funding is flat at 0.0011%, though, and longs are still crowded at a 2.86 ratio, so a full flush may not have happened yet.
If you found today’s post helpful, please subscribe and like.
Real-time briefings and new-post alerts on Telegram: t.me/corecryptoinsights · Follow on X: @core_trading1
If you’ve been trading without a fee payback, you’ve been losing money this whole time — start getting your trading fees back today.
▶ BingX 45% fee payback — full sign-up guide
▶ Bitunix 70% fee payback — full sign-up guide
▶ BingX vs Bitunix — which saves you more?
Leave a Reply