Bitcoin is falling today because it traded as high-beta tech exposure, not as a macro hedge. BTC dropped to about $61,773 (▼2.9%), a roughly five-month low, alongside a 2.25% Nasdaq selloff. That happened even though the 10-year yield fell 0.28% and the dollar weakened, two conditions that normally support crypto.

Bitcoin was handed close to ideal macro conditions this session and still could not hold up. Yields dropped sharply, the dollar index eased, and BTC fell anyway. Gold also slid 3.4%, so the defensive trade offered no protection either. This report grades Bitcoin against the three stories most often used to justify owning it. Then it looks at the institutional ownership data, which helps explain why the asset keeps behaving like a leveraged Nasdaq position.
The Macro Stress-Test Report Card
Each popular Bitcoin narrative makes a testable prediction. Today’s tape tested all three at once:
| Narrative | What it predicts | Today’s data | Grade |
|---|---|---|---|
| Rate-cut beneficiary | Falling yields lift BTC | 10Y ▼0.28% to 5.05%, BTC ▼2.9% | F |
| Dollar hedge | Weaker DXY lifts BTC | DXY ▼0.16% to 103.74, BTC ▼2.9% | F |
| Digital gold | Moves with or replaces gold in stress | Gold ▼3.43% to $3,559, BTC ▼2.9% | Incomplete / F |
| High-beta Nasdaq proxy | Falls with tech | Nasdaq ▼2.25%, S&P 500 ▼2.02% | A |
The only story that fit the numbers was the one bulls like least.
Why is Bitcoin falling when yields are dropping?
A 0.28% drop in the 10-year yield in one session is a large move. In a liquidity-driven framework, it should have been enough to lift duration-sensitive risk assets, and BTC is supposed to be one of them. The rate-cut beneficiary thesis assumes BTC responds to the price of money. Today it responded to the mood of equity holders instead.
That mood came from AI. Concern ahead of Nvidia earnings, plus worry that a possible Anthropic IPO could pull capital out of existing AI holdings, pushed the Nasdaq down 2.25% to 23,879. When yields fall because investors are moving into safety rather than because the Fed is easing on purpose, the drop in yields signals fear, not liquidity. BTC picked up on that and traded with the risk-off side.
The dollar result tells the same story. A softer DXY at 103.74 usually loosens global financial conditions at the margin. A 0.16% move is modest, but it pointed in the right direction and still did nothing for price.

Is Bitcoin still digital gold?
This grade is less clear-cut, and that matters. Gold falling 3.43% on the same day is an unusual pattern for a stress session. It looks like forced selling, with investors raising cash wherever they have gains. BTC losing slightly less than gold over 24 hours does not show that it behaves like a hedge. It shows that both assets were sold to fund losses elsewhere.
A real digital-gold test needs gold to hold steady while equities fall. That did not happen here, so the narrative did not get a fair test. Even so, BTC failed to stand out as the stronger of the two. It is down 8.97% over seven days, and that weekly loss looks like what you would expect from a tech stock.
The Institutional Ownership Paradox
On paper, the institutional picture is improving. Q3 13F filings show a net $4 billion flowing back into bitcoin funds, which ends nine straight months of net selling. That sounds like a solid base.
Tom Lee’s observation turns it around: the median institutional allocation to crypto is still zero. Most surveyed institutions hold nothing at all. The $4B came from a relatively small group of allocators, and many of them returned only recently.
That matters for price behavior. A holder base that is thin, recent and momentum-driven does not provide much support in a drawdown. These buyers came in because BTC was trending, and they tend to manage the position alongside their equity book. When the Nasdaq sells off, the same risk committee cuts both positions. A newly arrived institutional base does not reduce equity beta. It adds to it, because the marginal holder is a portfolio manager reducing gross exposure, not a long-term holder sitting through volatility.
Sidebar: VanEck, Gemini and custody hygiene
VanEck dropping Gemini as custodian for its BTC, ETH and SOL ETFs received little attention, but it is worth reading closely. Issuers rarely change custodians without reason, and doing it during a stressed market suggests counterparty risk is being reviewed. Nothing here points to a problem at Gemini. It does show that institutional crypto exposure is still handled with caution rather than conviction. Allocators who are still reviewing custody arrangements are not likely to be adding aggressively on dips.
On-Chain: Steady Network, Shrinking Dry Powder
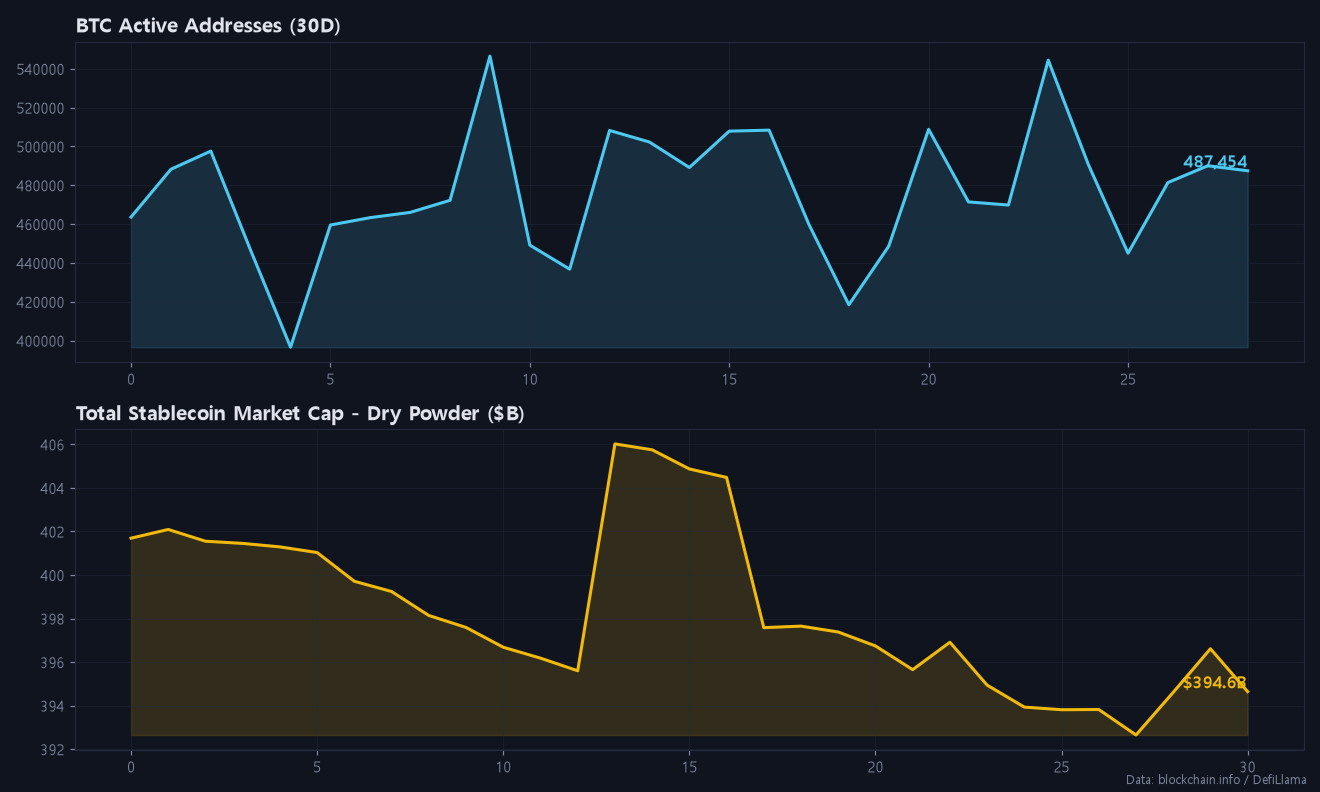
Network activity is holding up much better than price. Active addresses came in at 487,454, almost exactly matching the 7-day average of 486,993 and 2.3% above the 30-day average. Transaction count reached 674,354, or 9.2% above its 30-day average. Fees remain very low, with fast mempool fees at 2 sat/vB, so the higher activity is not coming from congestion.
Hashrate stands at 1,052.2 EH/s, essentially flat (▼0.3%) over 30 days. That rules out miner capitulation as a source of selling pressure for now.
The weaker signal is liquidity. Total stablecoin market cap is $394.6 billion, down about $7.04B over 30 days and $0.3B over the past week. Stablecoins are the crypto market’s cash available to buy. When that pool shrinks during a drawdown, it means capital is leaving the ecosystem rather than waiting on the sidelines to buy the dip.
The chart above shows the gap: active addresses moving within a stable 400k–550k range while stablecoin supply slowly declines. Usage is intact, but there is less fresh capital to buy.
What are today’s key BTC support levels?
The levels that matter:
- $60,000: psychological support. A clean break opens the way to $58,500.
- $63,800: first resistance and the most likely zone for sellers to step in on a bounce.
- $65,500: second resistance. Reclaiming it would reverse the short-term bearish structure.
- ETH: $1,700 support, $1,850 resistance, with price at $1,743.69 (▼3.34%).
Futures positioning adds risk. The Fear & Greed Index is at 12 (Extreme Fear), yet 76.9% of accounts are long with a 3.32 long/short ratio. Funding is close to zero (0.0001%), and open interest rose only 0.73%. This is not active buying. It is a crowd of longs holding on through the decline. If Nasdaq futures weaken further and $60k breaks, those positions become forced selling.
Trading Scenarios
Short scenario (primary bias): Avoid shorting into the current low. Wait for a bounce into $63,000–$63,800 and look for signs of rejection there. Invalidation is a close above $65,500. Targets are $60,000 first, then $58,500 if longs begin to liquidate. Reduce the short if the Nasdaq rebounds at the same time, because equity beta works in both directions.
Long scenario (conditional): Only consider it if $60k holds on a retest and the Nasdaq stabilizes. Entry would be $60,000–$60,800 with a stop below $58,500 and a target of $63,800. Without the equity confirmation, this is a low-probability setup.
Shorting bounces and stopping out repeatedly gets expensive. Fees add up quickly when you scale in and out of positions around these levels. If you trade actively, it is worth checking the BingX referral code guide with 45% fee payback or the Bitunix 70% fee payback sign-up guide. Fee-payback signup links are also listed at the end of this post.
My Take
I think this session should change how people present the bull case. “Rates are falling, so Bitcoin goes up” was tested under almost ideal conditions and did not hold. Until BTC shows it can rise on a day when the Nasdaq falls, I will treat it as a leveraged tech position with a 24/7 order book. That points to a tactical short bias for now. The next useful signal will come from ETF flow prints, not from Fed pricing.
Risk warning: The crowded long positioning that supports the bearish case can also produce sharp short squeezes, especially if Nvidia earnings beat and AI stocks recover. Size positions so that a move to $65,500 is a manageable loss, not a fatal one.
Signposts for Independent Price Action
- Weekly ETF flows: Several consecutive weeks of net inflows during equity weakness would be the first real evidence of conviction buying.
- BTC-Nasdaq correlation: A falling rolling correlation would show BTC moving away from equity beta.
- Gold stabilizing first: If gold finds a floor and BTC follows it rather than the Nasdaq, the digital-gold thesis gets a real test.
FAQ
Why did Bitcoin drop even though yields fell?
The yield drop reflected investors seeking safety, not new liquidity. BTC followed the Nasdaq’s 2.25% decline down to about $61,773 instead of responding to the 0.28% fall in the 10-year yield.
What is the key support for Bitcoin right now?
$60,000 is the main psychological support. A break below it exposes $58,500, with 76.9% of futures accounts still positioned long.
Are institutions buying Bitcoin again?
Q3 13F data show $4B in net inflows into bitcoin funds, but Tom Lee notes the median institutional allocation is still zero, so the holder base remains thin.
If you found today’s post helpful, please subscribe and like.
Real-time briefings and new-post alerts on Telegram: t.me/corecryptoinsights · Follow on X: @core_trading1
If you’ve been trading without a fee payback, you’ve been losing money this whole time — start getting your trading fees back today.
▶ BingX 45% fee payback — full sign-up guide
▶ Bitunix 70% fee payback — full sign-up guide
▶ BingX vs Bitunix — which saves you more?
Leave a Reply